2026 Q2 Earnings Preview
rAIsing the Bar
By: Michael Reinking | Sr. Market Strategist; Eric Criscuolo | Market Strategist
July 14, 2026
Strong earnings, higher expectations, and the challenge of sustaining momentum
Key takeaways
- Q2 2026 S&P 500 EPS estimated +23.6% YoY — the 6th consecutive quarter of double-digit earnings growth and second straight >20%
- Revenues estimated up 12.3%, the second consecutive double digit increase and highest growth rate since Q2 2022
- Number of companies issuing positive guidance well above historical averages helping to drive EPS estimates up by nearly 5% during the quarter
- Key topics: AI investment, monetization, integration and disruption. Impact of geopolitical developments on supply chains, demand dynamics and margin durability.
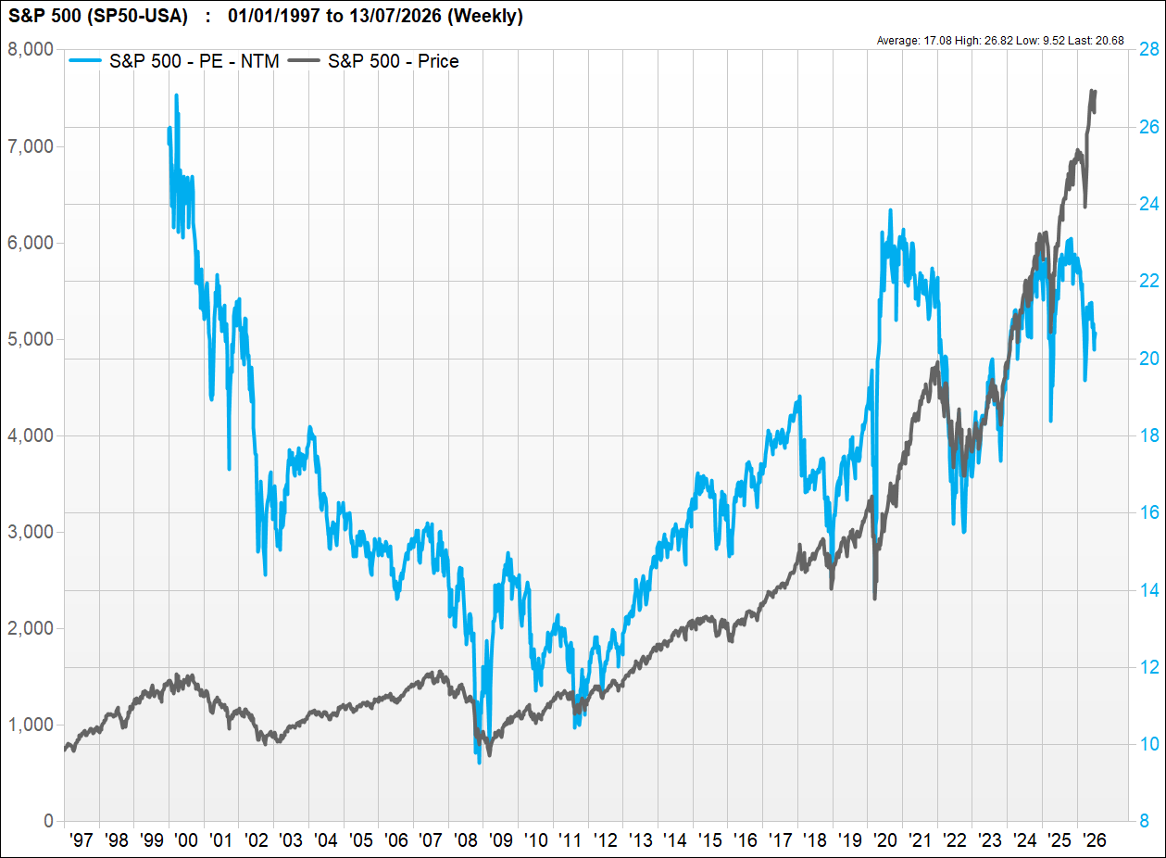
- Forward P/E has expanded to ~20x, modestly above 5- and 10-year averages, as the market repriced
Table of contents
What will investors be listening for on Conference Calls?
- Can you point to specific, quantifiable examples of AI driving margin improvement or revenue growth this quarter?
- What metrics are you using internally to track the transition from AI as a cost center to AI as a profit driver?
- To what extent is AI enabling headcount reductions, and is that showing up in operating leverage?
- With oil prices retreating from their Q1 highs, are input cost tailwinds materializing in margins? What are assumptions for the remainder of the year?
- Are there signs that demand was pulled forward in Q1? Is this impacting expectations for the back half of the year?
- Are there changes to the pricing strategy or have new mitigation measures been put in place to offset the increased input costs?
- Is the divergence between record-low consumer sentiment and resilient spending widening or narrowing?
- Are there early signs that lower-income cohort stress is creeping into spending data for mass-market retailers and financial services?
- How is credit quality trending in private credit and consumer lending books?
- After a quarter of meaningful earnings beats and upward revisions, will management teams raise full-year guidance or stay cautious?
- Do recent tax policy changes or higher-for-longer rates alter the mix between share repurchases, dividends, and reinvestment?
Setting the Stage — A Quick Lookback at Q2
As Q1 drew to a close, the S&P 500 was hovering near its year-to-date lows. However, signs of stabilization began to emerge during the final days of the quarter as investors grew increasingly confident that the administration was seeking an offramp in Iran. When a ceasefire ultimately materialized, positioning proved overly defensive, triggering a sharp risk-on reversal. A blowout first-quarter earnings season added further fuel to the rally, helping propel equities steadily higher throughout Q2. By quarter-end, major indices had posted double-digit gains and climbed to fresh all-time highs.
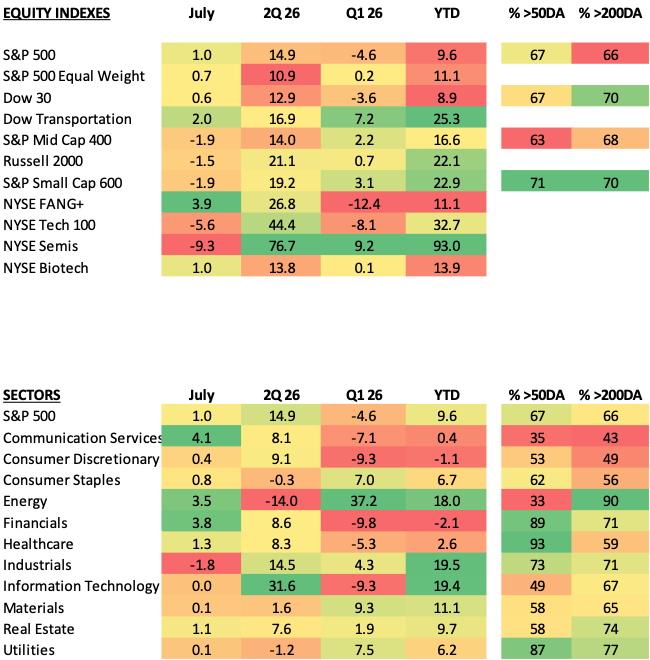
Beneath the surface, leadership evolved as the quarter progressed. The cap-weighted S&P 500 peaked in early June before investors rotated toward more cyclical and defensive areas of the market. Mega-cap technology stocks, which had driven much of the market's gains over the previous several years, began to lag as investors increasingly questioned the sustainability of massive AI-related capital expenditures and their impact on free cash flow generation. Rather than abandoning the theme altogether investors instead followed the money - semiconductors and memory stocks, the biggest beneficiaries of that spending, surged with the ICE Semiconductor index up nearly 100% during the quarter. More broadly, breadth improved meaningfully, with small-cap, value, and cyclical sectors all contributing to gains—an encouraging signal that investors are increasingly pricing in a durable economic expansion rather than a rally driven solely by a handful of technology stocks.
Commodity and fixed income markets painted a more nuanced picture. Oil prices peaked in mid-May before retracing nearly all of the gains associated with the start of Operation Epic Fury. Treasury yields, however, did not follow the same path, particularly at the front end of the curve. Sticky inflation data and a more hawkish tone from new Fed Chair Warsh reinforced concerns that policy may need to remain restrictive for longer. Since the onset of the Iran conflict, market expectations have shifted from anticipating additional rate cuts to increasingly pricing the possibility of one or two rate hikes before year-end.
From a fundamental perspective, the economy continues to provide a supportive backdrop heading into earnings season. Consumer spending has remained resilient, labor market conditions remain healthy, and economic activity has largely exceeded expectations. At the same time, risks have begun to re-emerge. Tensions with Iran have escalated in recent weeks, with both sides exchanging fire and Iran seems determined to exercise control over the Strait. While investors continue to view a significant escalation as unlikely, particularly ahead of midterms, oil prices and Treasury yields have begun moving higher again.
Against that backdrop, expectations remain elevated. The market has largely looked through geopolitical risks and rewarded strong earnings momentum which is expected to continue. With equities sitting near record highs that leaves little room for error.
Inside the Numbers - Data compliments of FactSet Earnings Insight as of of July 10, 2026
Q1 2026 Final Review
- Q1 S&P 500 blended earnings growth ~27.7% YoY vs. 12.6% estimate
- 84% of companies beat analyst estimates — highest rate since Q2 2021
- Q1 Revenue growth 11.3%: all 11 sectors reported YoY growth, led by Info Tech, Communication Services, and Utilities
Q2 2026 EPS Estimate: +23.3% YoY
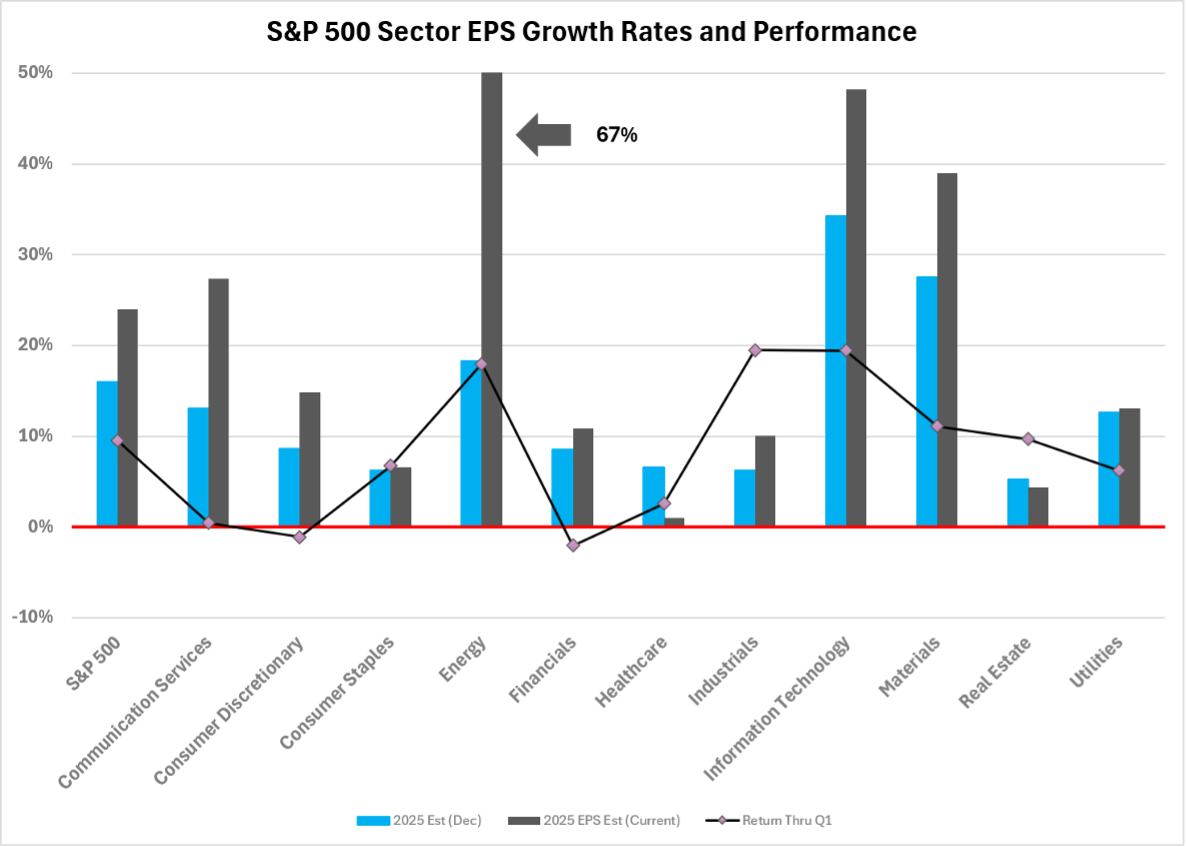
- Top-growing sectors: Energy (122.9%), Information Technology (+63.3%), Materials (35.3%)
- Declining sector: Health Care is the only sector projected to report a YoY earnings decline
- Percentage and number of companies issuing positive guidance above historical averages (56% vs. 5/10yr avg. of 41%)
Q2 2026 Revenue Estimate: +12.3% YoY
- Highest projected revenue growth rate since Q3 2022; all 11 sectors expected to grow revenues
- Leaders: Info Tech (+34.2%), Energy (27%), Comm. Services (+13.7%)
Q2 2026 Net Profit Margin Est.: 14.2%
- Down from last quarter’s (14.8%) but above year-ago (12.9%) and 5-year average (12.3%)
- Forward 12-month P/E: ~20.5x — above the 5-yr avg. (19.9x) and 10-yr avg. (19x) but down from 22X at the start of the year
Looking Ahead: Full-Year 2026 Outlook
| Quarter | Q1 2026A | Q2 2026E | Q3 2026E | Q4 2026E |
|---|---|---|---|---|
| EPS Growth (YoY) | ~27.7% | +23.3% | +26.6% | +24.3% |
| Revenue Growth (YoY) | 11.3% | +12.2% | 10.6% | 10.3% |
CY 2026: EPS growth estimate +24.2%, revenue growth estimate ~11%
The Big Picture
Macro uncertainty dominated the conversation heading into Q1 earnings season. While some of those concerns remain in the background, the focus has shifted meaningfully toward expectations. Following a blowout Q1 reporting period—when S&P 500 earnings growth came in nearly double the consensus estimate— there continued to be positive revisions and pre-announcements.
Since the start of Q2, consensus estimates for the quarter have increased by nearly 5%, leaving the Street looking for roughly 24% EPS growth and a second consecutive quarter of >20% earnings growth. The optimism extends beyond Q2. Consensus forecasts now call for more than 20% earnings growth in both Q3 and Q4, while 2027 estimates continue to move higher, with nominal EPS expectations rising approximately 10% since the beginning of the quarter.
As usual, Financials will help set the tone. Q1 was defined by strong trading revenues, M&A activity picked up but uncertainty pushed out a pickup in capital markets activity. Importantly, there were few signs of deterioration in credit quality. This quarter, investment banking revenue should become a more meaningful tailwind as management teams continue to point to robust deal pipelines. Trading activity remained healthy throughout the quarter and loan growth appears to have improved. Investors will continue to scrutinize credit metrics, particularly within consumer and private credit portfolios, but recent commentary from management teams has remained sanguine.
Within Technology, many of the AI spending beneficiaries have already pre-announced strong results, and there is little reason to believe the fundamental backdrop has deteriorated. The bigger debate is no longer whether growth remains strong, but whether it is sustainable. Some investors have questioned whether a portion of demand was pulled forward into Q1, potentially creating a more challenging comparison over the second half of the year.
Hyperscaler earnings calls may provide insight into that dynamic, but the discussion increasingly extends beyond a handful of large-cap technology companies. Investors continue to seek clearer evidence that AI investments are generating measurable returns and want a better understanding of when the gap between spending and revenue realization will begin to narrow. These questions have taken on added importance amid growing concerns around excess compute capacity and the capital intensity required to support continued infrastructure expansion.
Ultimately, the answers will depend on the pace of enterprise AI adoption and whether customers begin moving beyond the experimentation phase. Investors will be looking for tangible examples of productivity gains, efficiency improvements, and margin benefits tied directly to AI deployments. Commentary around IT budgets may also be important, particularly as several companies have recently highlighted rising token and inference costs.
Outside of Technology, one of the defining themes of Q1 earnings season was the disconnect between strong results and cautious guidance. Despite broadly exceeding expectations, many management teams stopped short of meaningfully raising outlooks given the uncertain macro backdrop. If corporate leadership teams have gained greater confidence in the operating environment over the past several months, that guidance gap could narrow this quarter, creating an additional tailwind.
The net profit margin for the S&P 500 hit a record 14.8% in Q1 2026 — the highest level since FactSet began tracking the metric in 2009, surpassing the record of 13.2% hit in the prior quarter. The headline carries an asterisk: a meaningful portion of the expansion was driven by non-recurring GAAP items at three Magnificent 7 companies — equity gains, investment markups, and a one-time tax benefit. Stripping those out, the structural picture is still constructive. Margins are projected to hold >14% through the back half of the year. The risk is that the elevated margin structure, while a key support for the earnings growth story, also represents a vulnerability with energy costs remaining stubbornly elevated, memory chip prices rising as AI hardware demand outstrips supply, and Strait of Hormuz bottlenecks adding further pressure to supply chains. If the cost backdrop doesn’t improve that suggests the street expects the increased costs to be offset by AI-driven efficiency gains or price increases.
The S&P 500 is up ~10% YTD pretty much the same amount that 2026 EPS have increased over that time frame leaving the multiple pretty much unchanged ~20X while PEG ratios have contracted.
Over the past five years, management teams have navigated a seemingly endless series of challenges while consistently delivering results that exceeded expectations. Last quarter was no exception, with companies producing another strong earnings season despite operating under the fog of war. Heading into this quarter, however, the debate has shifted. The challenge is no longer whether management teams can navigate a difficult environment, but whether they can continue to clear a substantially higher bar. Rasing the question as to whether expectations have finally gotten ahead of fundamentals. In other words, corporate America may be at risk of becoming a victim of its own success.