
February 17, 2021
SPACs are the talk of the town today but until two years ago, few investors were even familiar with the term “Special Purpose Acquisition Company” (even though SPACs, sometimes thought of as “blank check companies,” have been around since the 1990s).
So what exactly is a SPAC? It is an entity formed via a capital raising on the NYSE (or another exchange). The entity is formed by sponsors with particular expertise for the specific purpose of merging with an existing, typically late-stage, private company. The private company is not known to the SPAC investors or the SPAC sponsors at the time of the IPO. The SPAC typically has two years to find a merger candidate, or it is liquidated. In the meantime, the funds raised by the SPAC generate interest in an account. The event of the merger between the SPAC and the private company essentially makes the private company public, so the company needs to be ready for the requirements associated with being a listed entity.
SPAC structures vary, although the majority of SPAC IPOs consist of a unit that combines a share of the SPAC’s stock plus a kicker, which is usually a fraction of a warrant to buy an additional share of stock. The SPAC unit trades like any other stock and an investor can buy or sell the unit at any time. Typically, around the 52nd day following the IPO of the SPAC, the SPAC can be traded either as a unit or as each of its separate components.i
The NYSE Advantage
NYSE SPACs range from small-cap to large-cap and NYSE SPAC sponsors have a broad range of expertise across sectors. One reason SPACs choose to list on the NYSE is because of our unique Designated Market Maker (DMM) model, which increases market quality. For example, in addition to having quoting obligations throughout the day, DMMs conduct auctions for SPACs. DMMs enable larger auctions at more stable prices, benefitting the SPAC issuer and its investors alike. This performance benefit is one reason the NYSE is the world’s premier exchange.
The table below highlights these market quality advantages. NYSE SPACs show superior Open Price Accuracy on launch and have larger trading volume and more liquid opens.
SPAC Merger Completion from January 1, 2019 through January 22, 2021
| 0% Floor | NYSE | Nasdaq |
| Median Market Cap. First Day ($ Million) | $2,720 | $741 |
| Median Daily Trading Volume | 1,782,238 | 337,576 |
| Median Open Price Dislocation (bps)ii | 113 | 202 |
| Median Open Volume | 14,504 | 2,319 |
| Median Open Auction Volume as % CADV | 1.28% | 0.45% |
Recent SPAC Trends
- It’s fair to say that SPAC issuance has boomed over the past two years.
- After a total of 14 IPOs in Q1 2019, and 13 IPOs in Q2 2019, 122 SPACs came to market in the last quarter of 2020.
- 66 SPACs came to market in the first three weeks alone of 2021.
- As SPAC issuance has surged, the expertise of the NYSE has enabled it to lead in new issue funds raised.
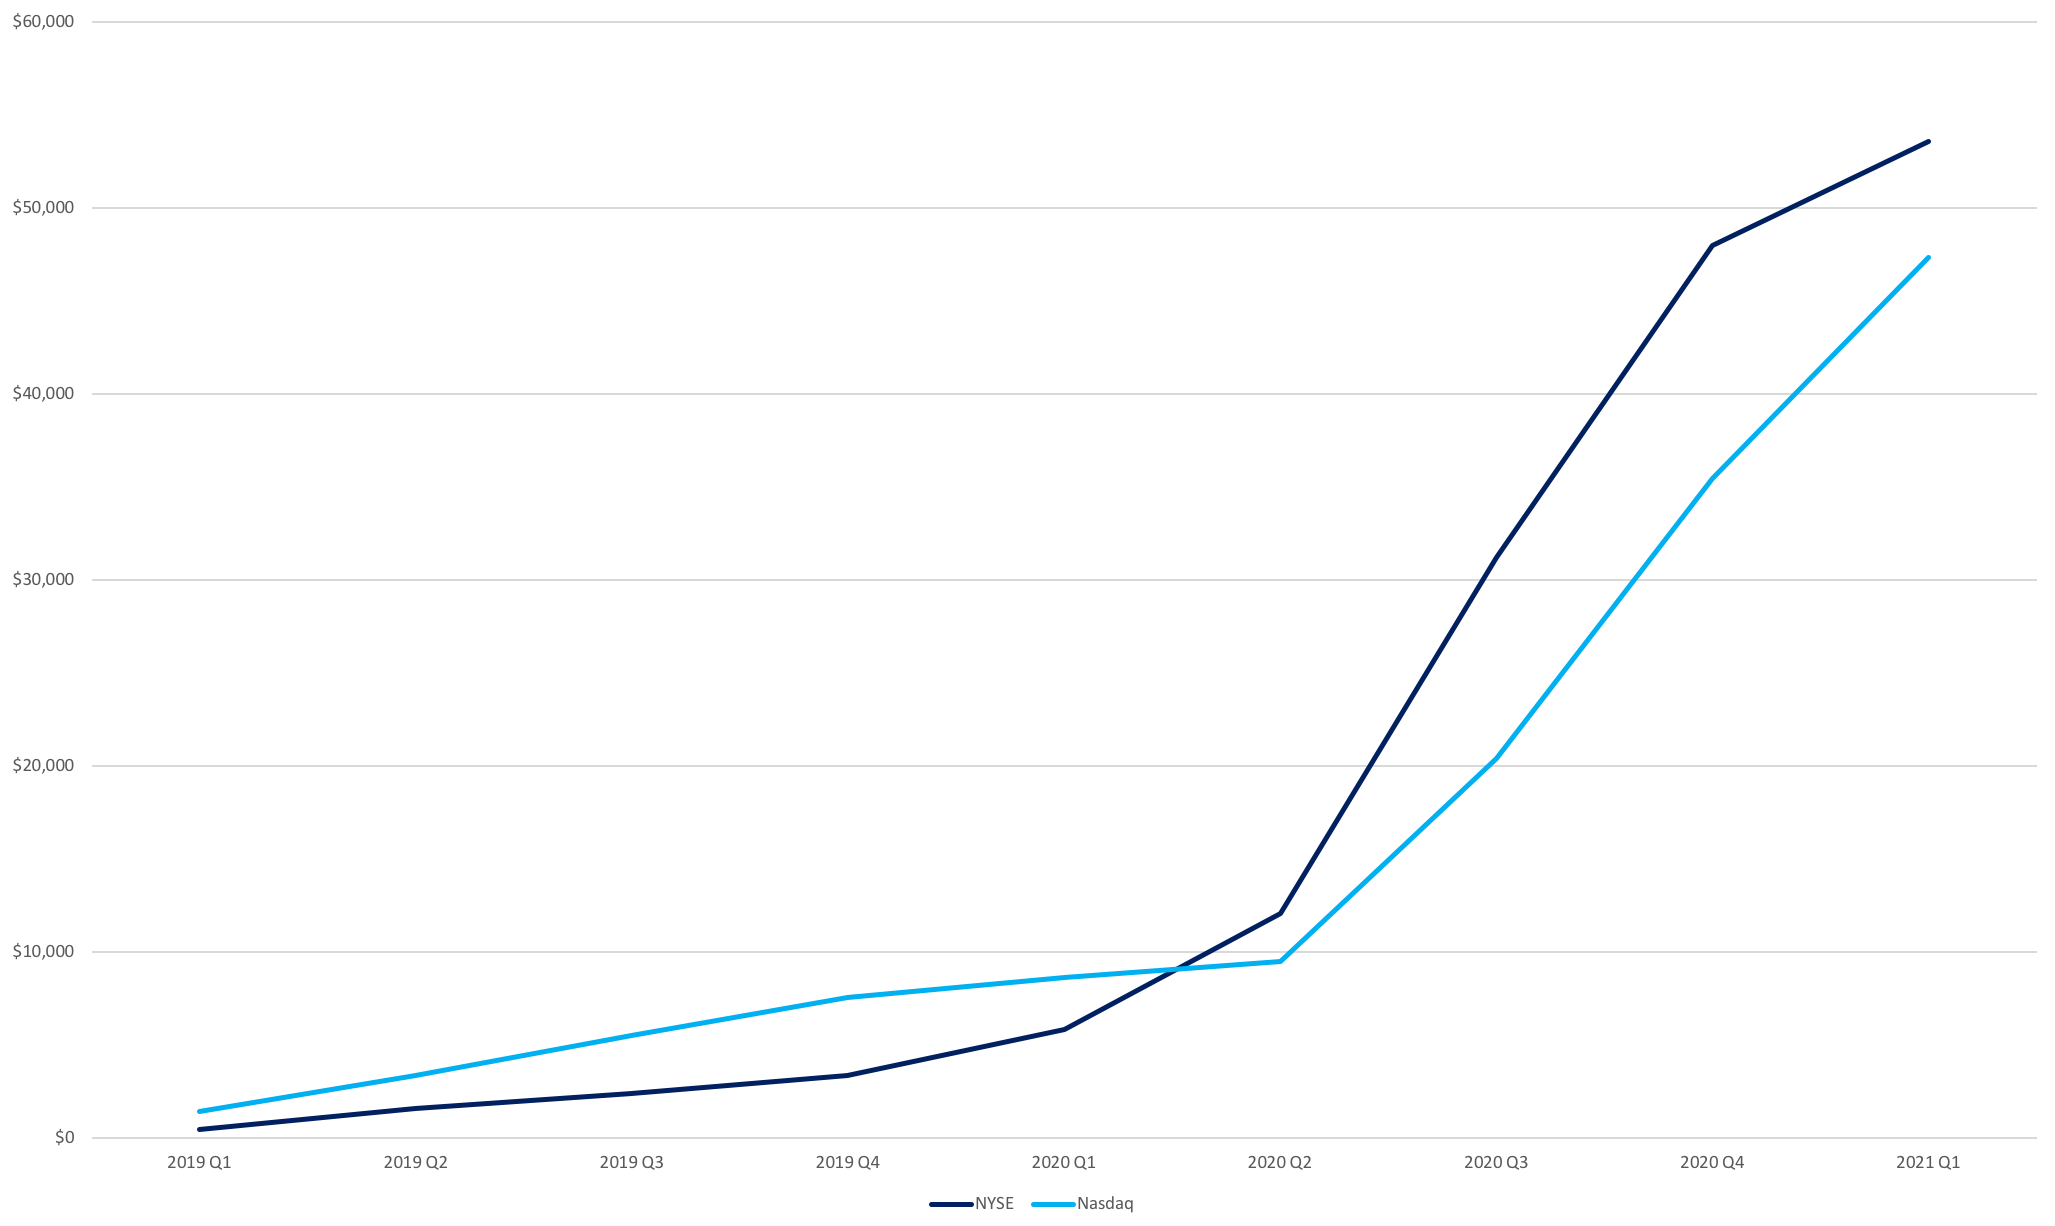
- As the chart below shows, the cumulative Dollar value of funds raised for SPACs has grown exponentially in the recent past.
Chart 1: Quarterly Cumulative SPAC Funds Raisediii
Cumulative SPAC IPO Funds Raised
($ millions)
- SPAC sponsors may identify their target merger sector upon launch, although they are not legally bound to do so.
- The SPAC sponsor’s incentives are aligned with those of its investors: the sponsors seek to maximize the value of the funds raised via the SPAC IPO.
- As such, if the sponsors find a better merger opportunity outside the sector they originally targeted, the sponsors can and should move forward with the more lucrative opportunity.
- In some cases, more than one merger opportunity can be sought.
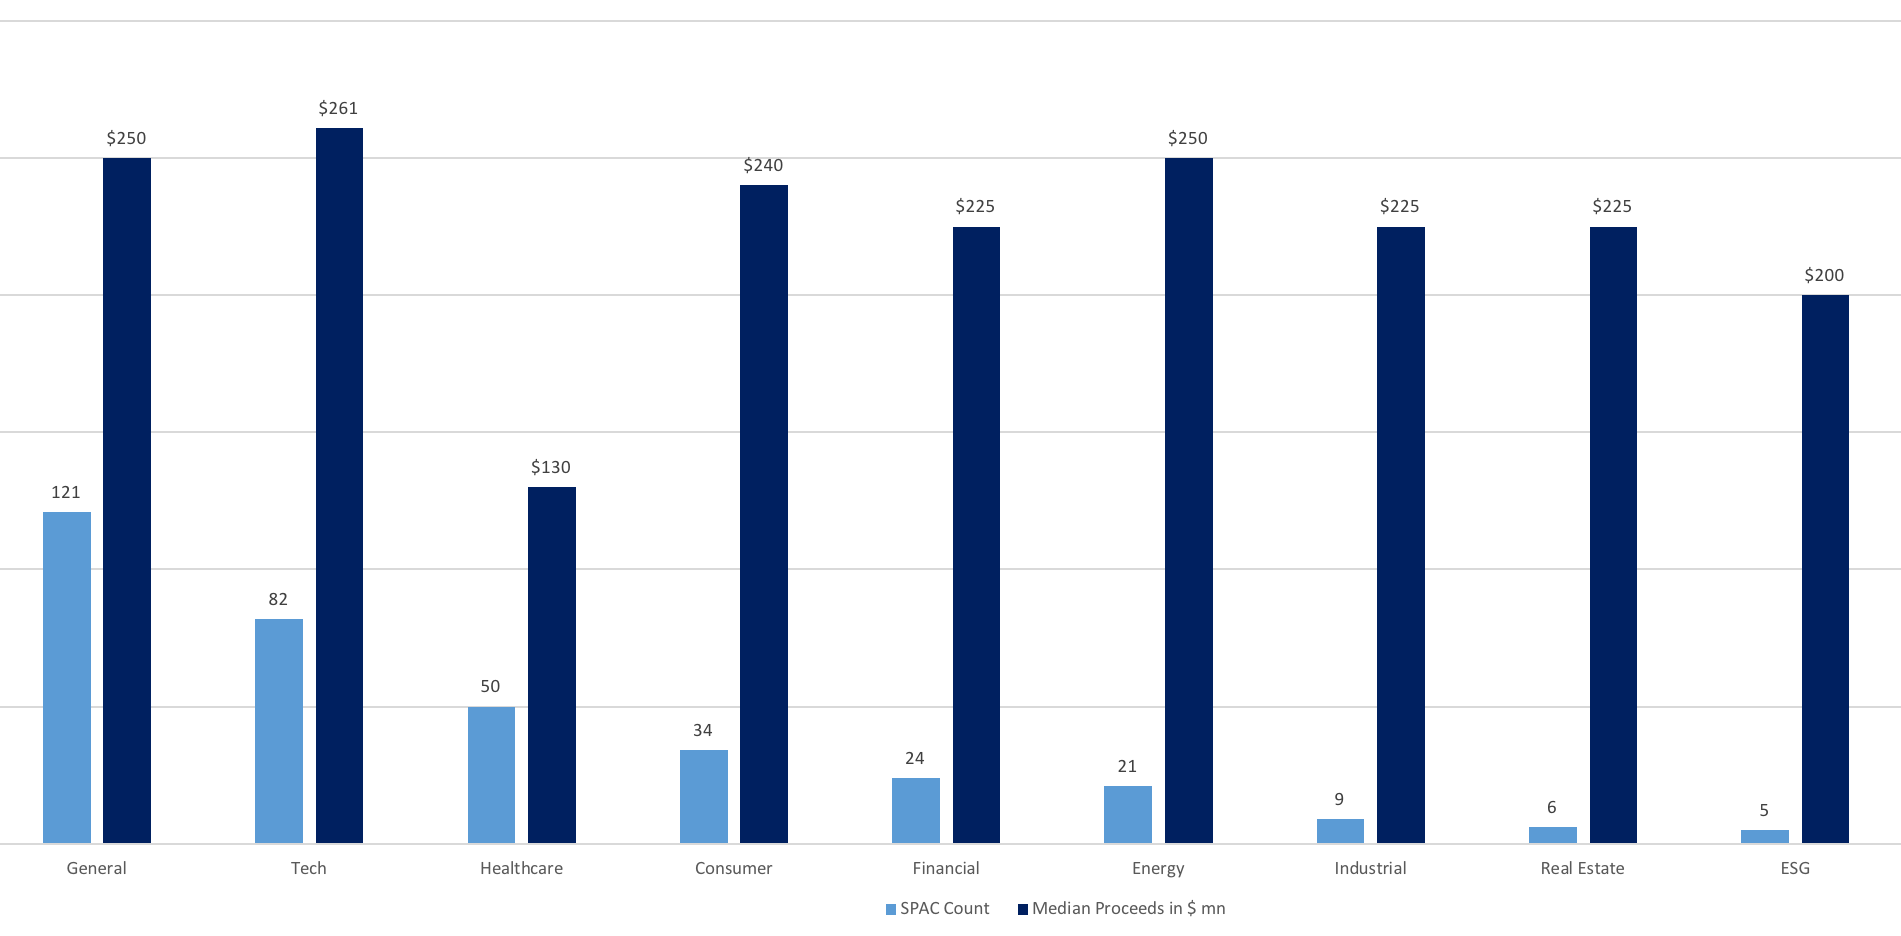
- Chart 2 below shows the median proceeds raised and the count of SPACs issued since the start of 2019, broken out by the sector named as the “target” at the time of the SPAC IPO (which, again, is subject to change).
Chart 2: SPAC Proceeds and Count by Sector
SPAC Median Issue Size and Count by Target Sector ($ million)
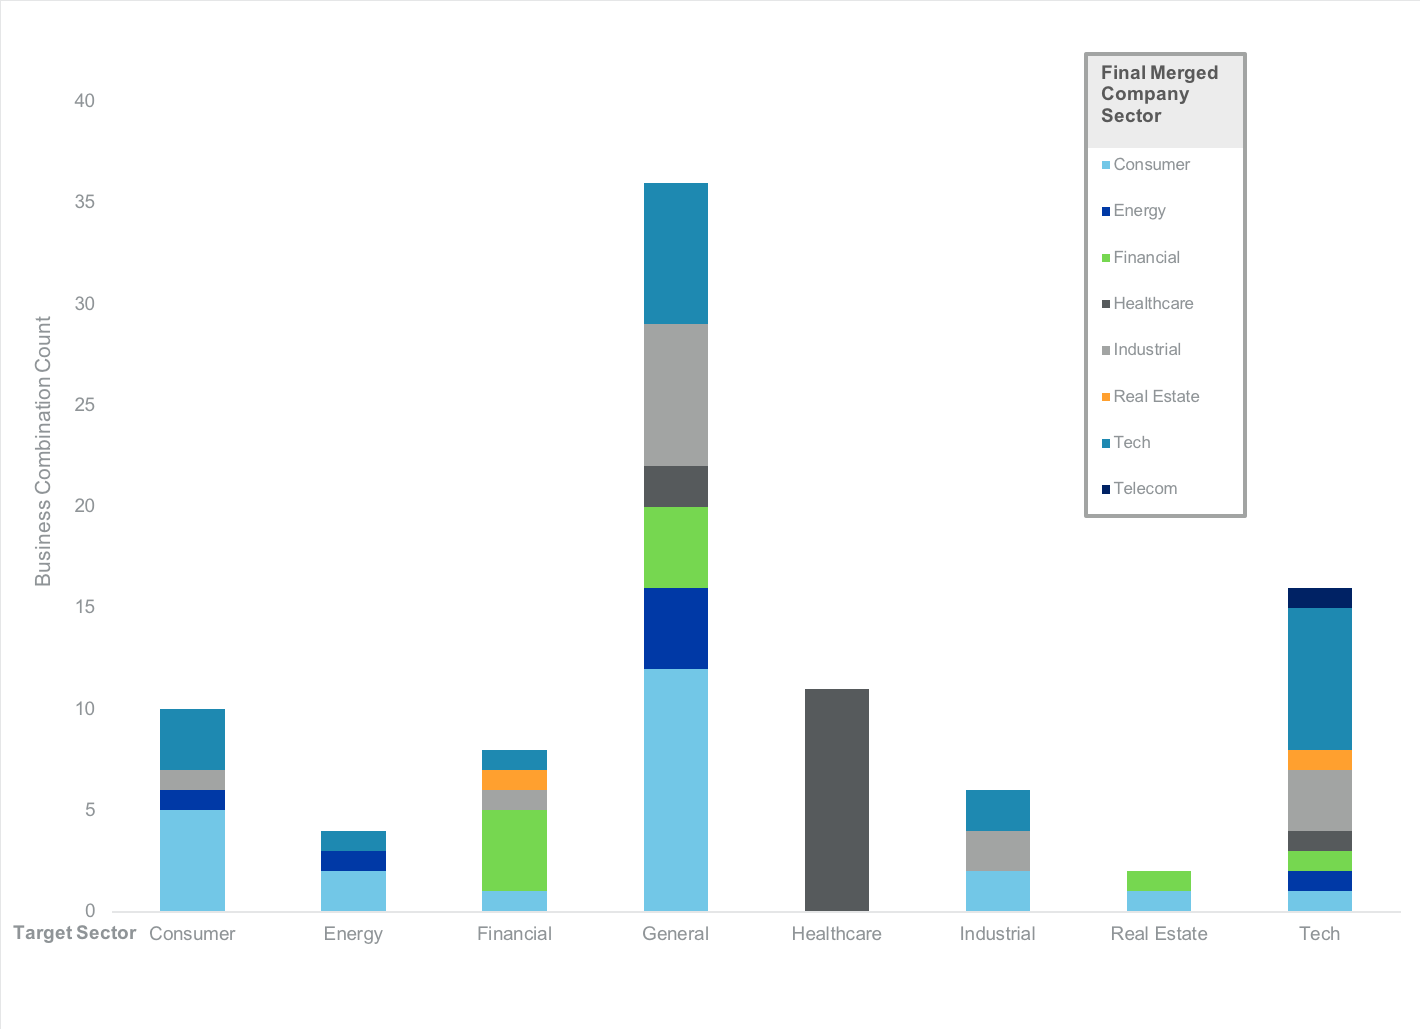
- Chart 3 below shows the final sector disposition of the merged company, grouped by the original SPAC target sector.
- In nearly all targeted sectors, the resulting combinations have included some firms from other sectors, highlighting SPACs’ flexibility.
Chart 3: Business Combination Sector Counts by Original Target Sector
SPAC Target Sector vs. Final Merged Company Sector
SPAC Performance
- To date, SPAC price performance and merger announcement and completion times have both been highly variable.
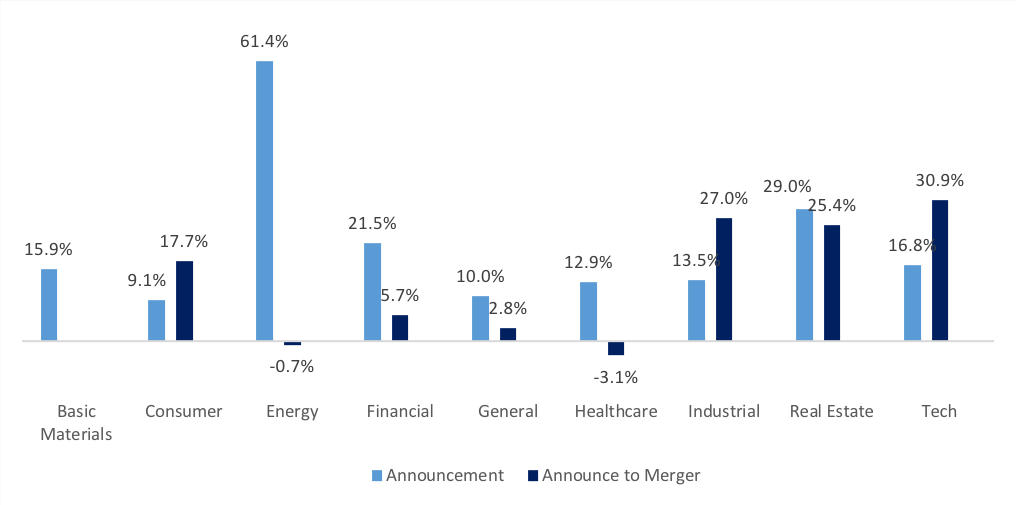
- Chart 4 below shows returns broken out by SPAC target sector for all SPACs that, at a minimum, identified a merger target or completed its combination since 2019.
- Overall, the median SPAC price change from IPO day to the merger target announcement date has been 14.5%, with an additional 10.0% earned between the target announcement date and the actual business combination
- The median price gain from SPAC IPO to merger has been 24.3%
- Note however that these results are very variable, as evidenced by an average return of 57.3%.
- Of the 91 business completions since 2019, announcement to merger price changes have ranged between a low of -71% to as high as 187%.
- 33 SPACs lost value following the announcement of the merger target, but only 12 lost value when measured from SPAC IPO to merger date.iv
Chart 4: Performance by SPAC Target Sector
SPAC Lifecycle Price Change
| Pending | Completed | |
| Basic Materials | 1 | 0 |
| Consumer | 12 | 10 |
| Energy | 11 | 4 |
| Financial | 16 | 8 |
| General | 58 | 35 |
| Healthcare | 20 | 10 |
| Industrial | 8 | 6 |
| Real Estate | 2 | 2 |
| Tech | 24 | 16 |
Concluding Thoughts
Although SPACs have existed for more than 20 years, it is only in the past two years that SPACs have become a popular method for a privately held company to become publicly traded and for investors to gain exposure to early stage single name growth opportunities. SPACs are now more likely to be larger and to merge with (or to utilize themselves) complex corporate structures. These developments increase trading complexity, making key trading events like initial auctions, where the NYSE has dominant expertise, vital to the success of the SPAC.
iFor more information on SPAC structure see https://www.sec.gov/oiea/investor-alerts-and-bulletins/what-you-need-know-about-spacs-investor-bulletin
iiAll opening auction statistics include mergers which had an opening auction on the day of the merger. Dislocation is measured as the difference between the 5-minute VWAP after the auction and the auction price in basis points.
iiiAll issuance data based on SPACs IPOs since 2019. Price changes are based on any acquisition target announcements or mergers since 2019, including SPACs that had their IPOs in 2017 and 2018.
ivWe calculate price changes from IPO offering price.
Get NYSE's Data Insights
NYSE Research Insights
Find all of NYSE Research's articles on market quality, market structure, auctions, and options.