
October 13, 2020
While this summer came to a close, activity in the options markets continued to heat up. September 2020 set a new record for options industry average daily volume at 30.1 million contracts, which was driven by volatility, a downturn in equities markets after recent new highs and, perhaps, a boost from two high-profile stock splits. In addition, three days in September are now ranked among the top 10 multi-list volume days in options trading history. Nine of the top 10 multi-list options volume days occurred in the first three quarters of this year; just one trading day from 2011 remains on the top 10 list and could fall out before year end, given the Presidential election is just a few weeks away.
Top Volume Days
| Rank | Day | Multi-List Equity & ETF Contracts |
| 1 | 6/5/20 | 45,000,097 |
| 2 | 6/11/20 | 44,734,438 |
| 3 | 9/3/20 | 43,009,148 |
| 4 | 2/28/20 | 42,842,722 |
| 5 | 9/4/20 | 42,779,466 |
| 6 | 2/27/20 | 40,334,447 |
| 7 | 6/12/20 | 39,504,828 |
| 8 | 8/8/11 | 37,972,071 |
| 9 | 2/25/20 | 37,162,324 |
| 10 | 9/2/20 | 36,057,892 |
Market Quality
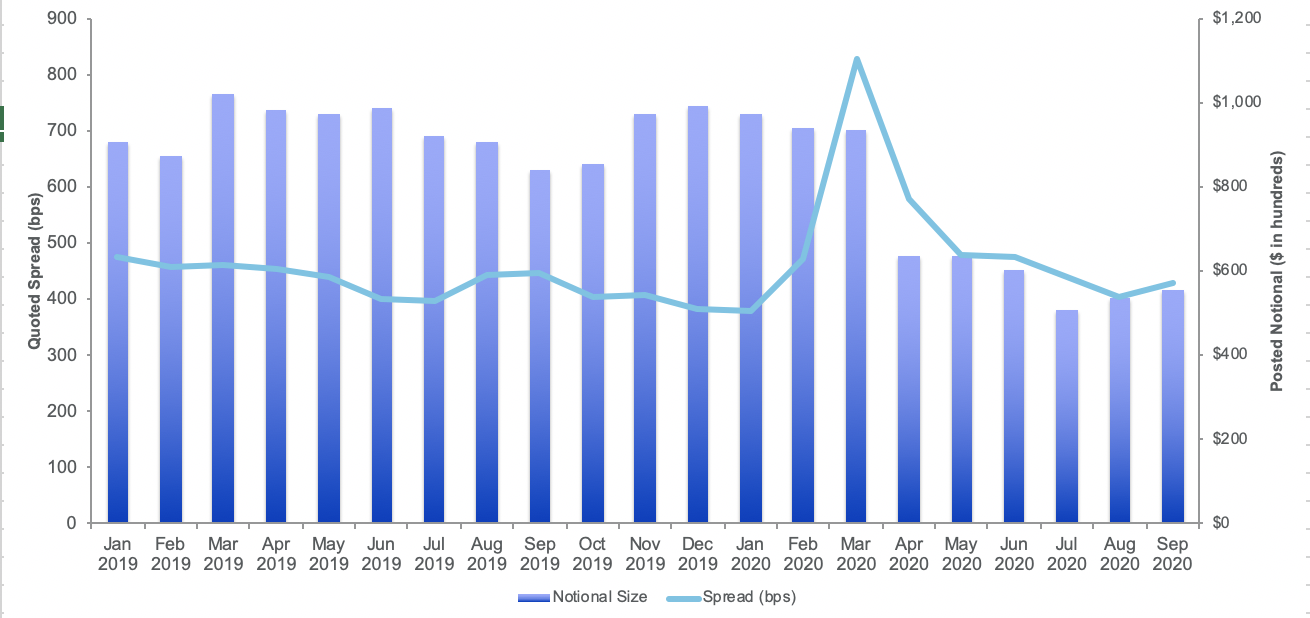
As we noted last quarter, options quoted spreads measured in basis points have returned to pre-pandemic levels. The displayed size at the best price has declined as spreads have tightened, with posted notional size 14% lower in Q3 than in Q2 (and notional size in Q2 was 32% lower than in Q1). On a monthly basis, however, posted notional size has improved each month in the quarter.
Quoted Spread (bps) and Posted Notional Size
High Profile Stock Splits
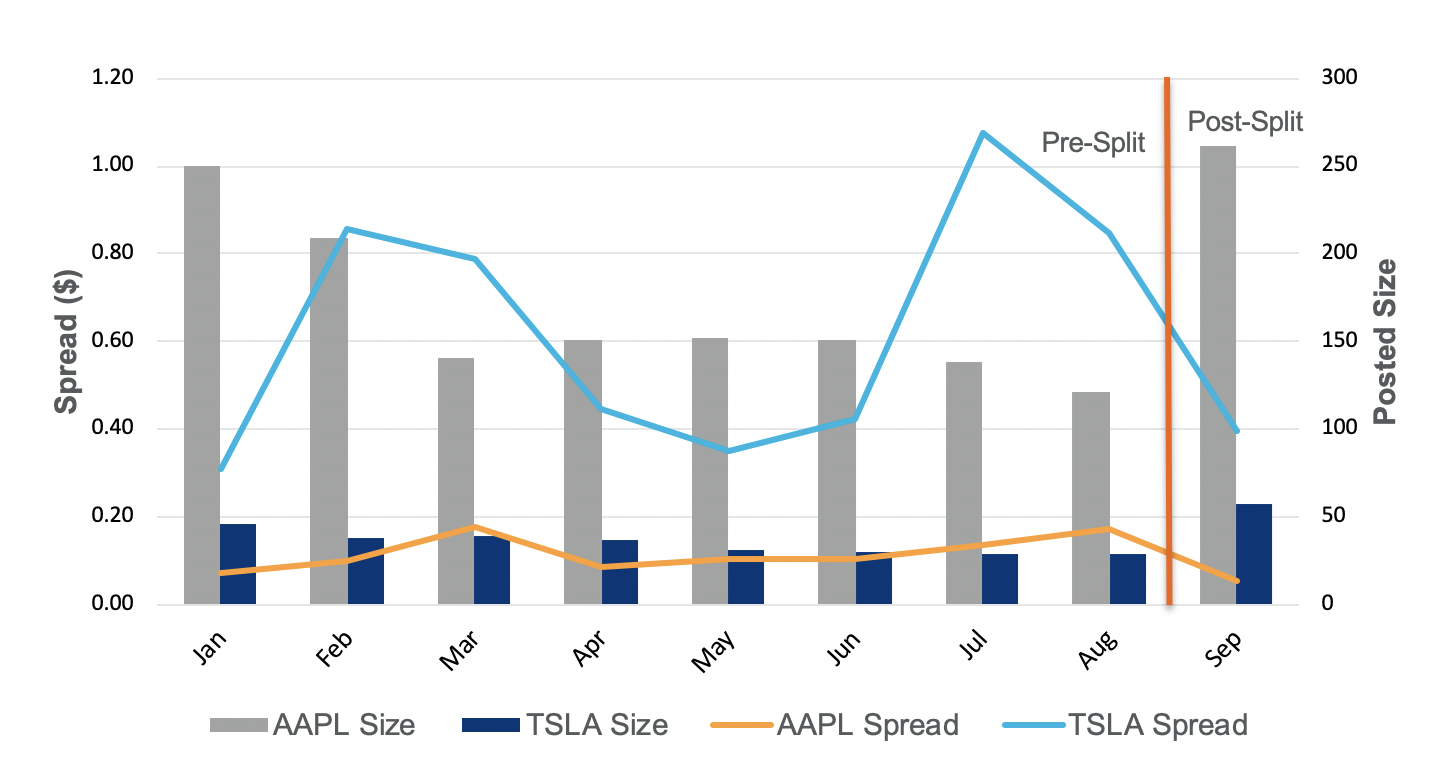
The third quarter saw two high-profile stock splits: shares of Apple (AAPL) split 4-for-1 on August 28, and Tesla (TSLA) split 5-for-1 on August 31. Following each split, AAPL and TSLA have experienced increased options volume. For AAPL, options volume is 3 times greater post-split than pre-split; TSLA’s volume is 2.6 times greater post-split. These stock splits had a significant impact on overall options volume, with post-split AAPL options accounting for 8.3% of multi-list volume, up from 3.3% pre-split, and post-split TSLA accounting for 4.8% of volume, up from 2.1% pre-split.
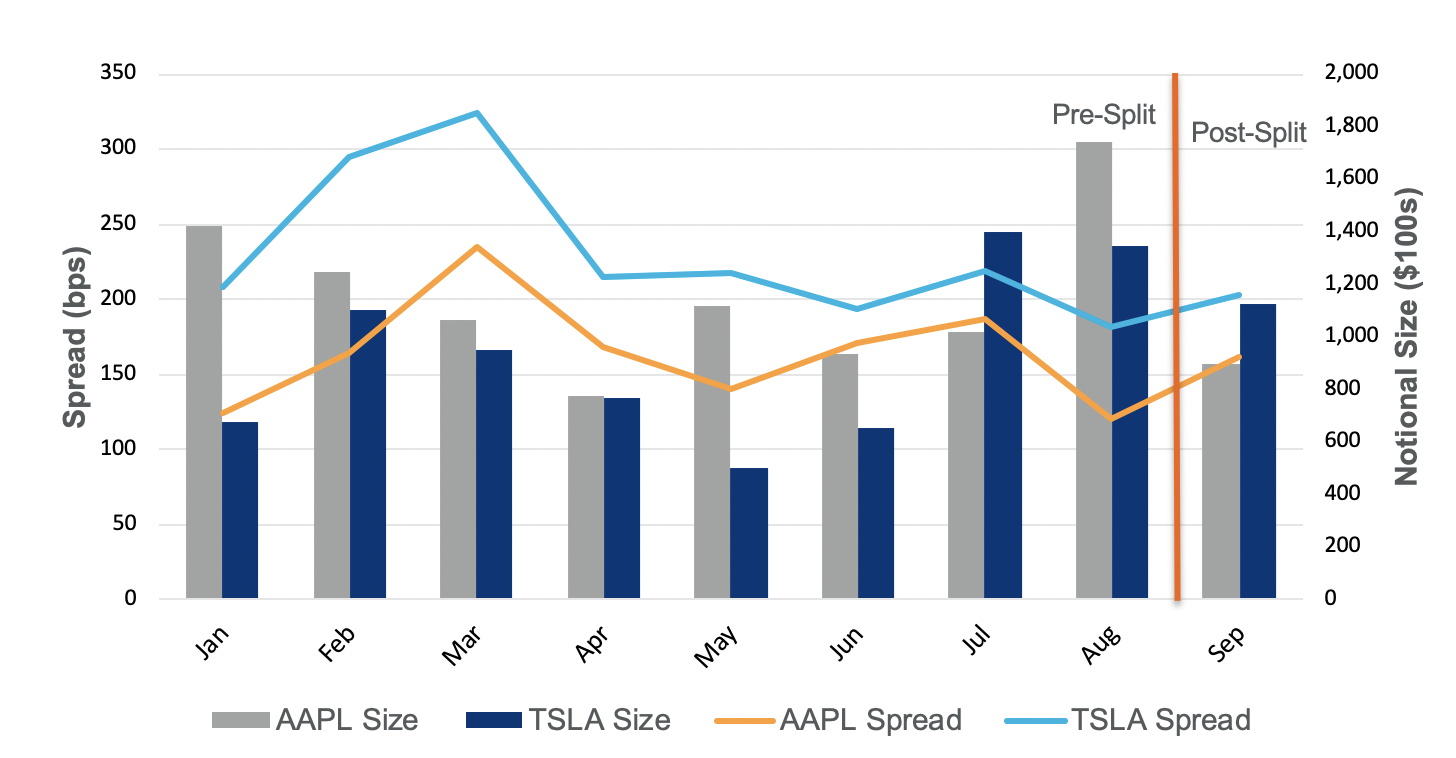
As expected, AAPL and TSLA market quality has improved in nominal terms. In general, a lower underlying stock price results in tighter nominal quote widths and a greater number of posted contracts to help maintain a similar level of pre-split posted market value. In notional terms, however, both AAPL and TSLA have wider quoted spreads measured in basis points and less posted size in market value terms following the splits. This could potentially be due to volatility and downward pressure on the tech sector in the month of September.
Spread($) and Size
Spread (bps) and Posted Notional Size
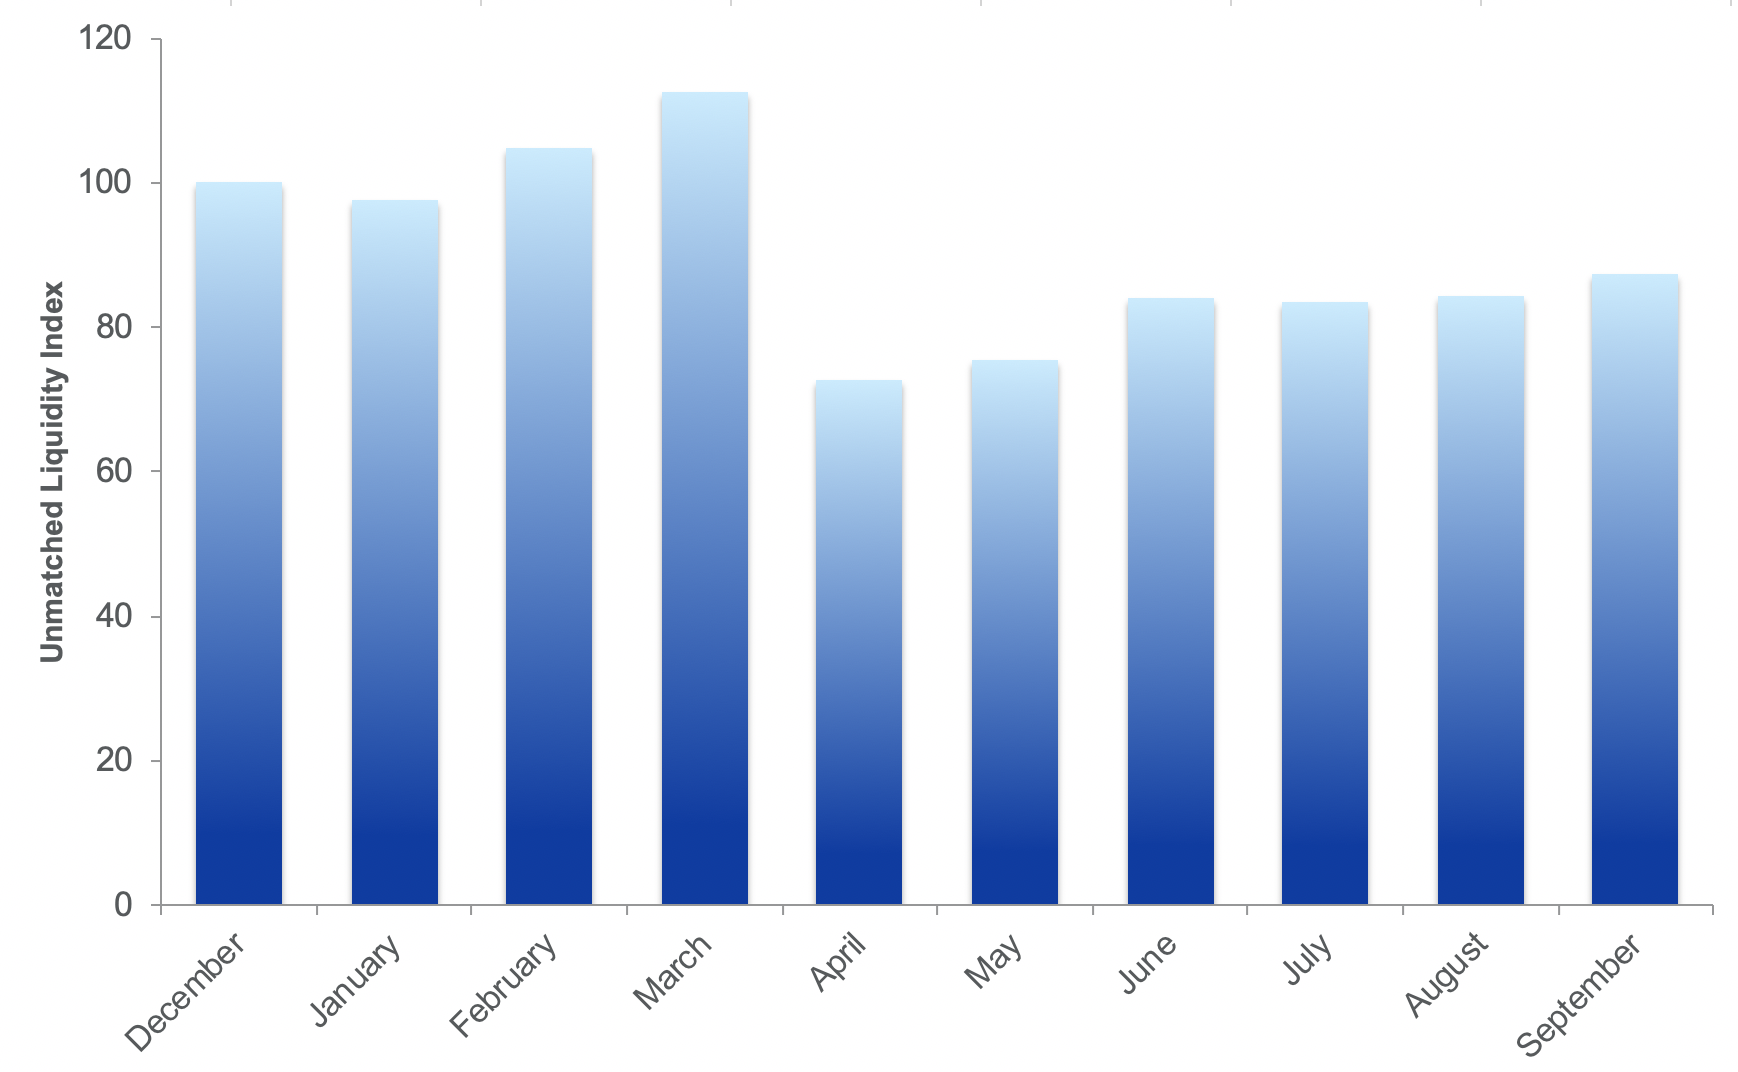
Unmatched Liquidity Index
In the second quarter, the NYSE introduced the Unmatched Liquidity Index to track the ratio of “unmatched volume” (non-auction and non-QCC volume) to “pre-matched volume” (auction and QCC volume). This index rose as volatility and market volumes increased into March, but then dropped from March to April when options trading floors closed. Retail trading increased dramatically as options volumes remained high during the closure period, suggesting that pre-matched orders were a key driver of market volume. However, record volume totals have not necessarily meant vastly expanded displayed liquidity across the market. The index continues to recover gradually and currently has a reading of 87.
Unmatched Liquidity Index
Volume Concentration
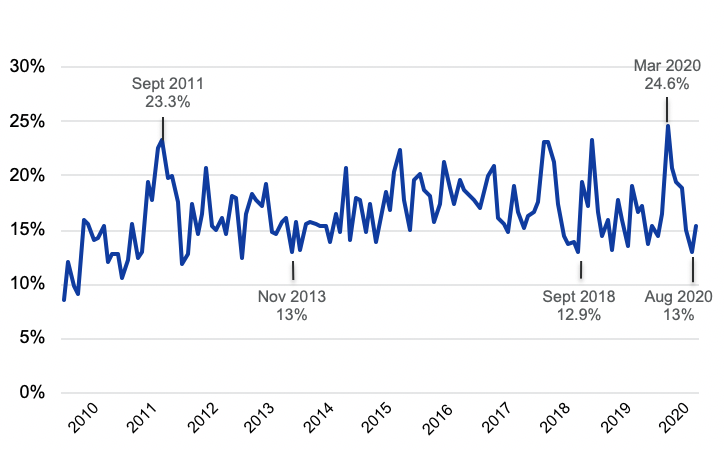
The volatility and recent stock splits have also impacted symbol concentration this year. Notably, SPY is no longer as dominant a driver of market volume as it has been in the past.
The first half of the year exhibited high SPY contribution to industry volume (19.3%), including the highest monthly SPY concentration on record in March (24.6%). In Q3, SPY fell to 14.2%, with one of the lowest SPY concentrations in the last 7 years in August (13.0%). Despite the low SPY contribution to industry volume, top 10 symbol concentration stayed flat, driven by an uptick in volume from other names in the top 10, such as AAPL, TSLA and several others.
SPY Volume Concentration
Top Symbols in 2020
| 2020 | ||
| Symbol | Rank | % of Total |
| SPY | 1 | 17.6% |
| AAPL | 2 | 3.9% |
| QQQ | 3 | 3.8% |
| TSLA | 4 | 2.5% |
| IWM | 5 | 2.1% |
| AMD | 6 | 1.6% |
| MSFT | 7 | 1.5% |
| SLV | 8 | 1.5% |
| FB | 9 | 1.2% |
| BAC | 10 | 1.2% |
| 2019 | |
| Rank | % of Total |
| 1 | 15.9% |
| 3 | 3.0% |
| 2 | 3.8% |
| 7 | 1.5% |
| 5 | 2.1% |
| 6 | 1.7% |
| 13 | 1.1% |
| 28 | 0.7% |
| 9 | 1.4% |
| 8 | 1.5% |
Conclusion
The options industry experienced record-setting volumes this year, and with the likelihood of more volatility on the horizon, we expect this trend to persist through year-end. The direction of quoted spreads and the Unmatched Liquidity Index show signs of recovery in market quality, and liquidity is less concentrated in a single underlying symbol (SPY). Nonetheless, market participants should remain prepared for a potential sharp reversal in these conditions, as political and macroeconomic risks remain.
NYSE Research Insights
Find all of NYSE Research's articles on market quality, market structure, auctions, and options.