October 3, 2019
Volatility and Spreads
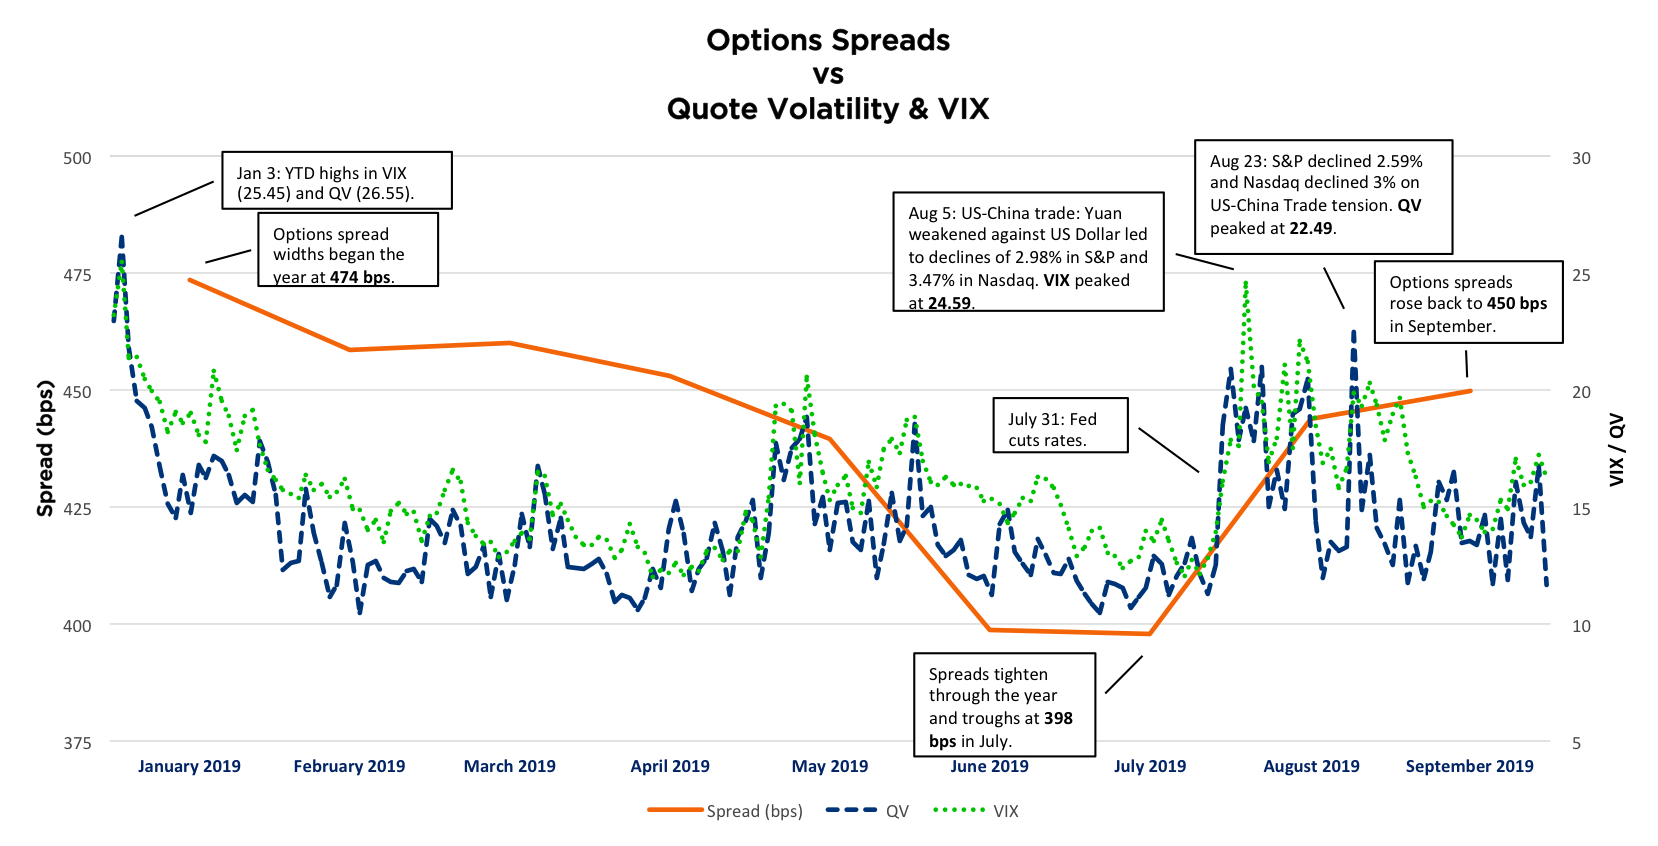
- Options spreads gradually tightened from 475 bps to under 400 bps through the first half of 2019 and into July, coming off the elevated volatility levels in the final months of 2018. Spreads in 2018 were 456 bps wide on average and ranged from a low of 417 bps to a high of 620 bps. We calculated the spread as a percentage of the option price in basis points.
- In August, volatility increased as measured by our Quote Volatility metric (QV) and the VIX - the result of the Fed lowering the target rate for the first time since the Great Recession at its July 31 FOMC meeting.
- The VIX closed at its 2nd highest level for the year on August 5 at 24.59. The market declined with the S&P down 2.98% and Nasdaq down 3.47% on US-China trade tensions that saw the Yuan weaken against the US Dollar.
- QV was elevated during much of August and peaked on August 23 at the 3rd highest level of the year, 22.49, on more US-China trade talk.
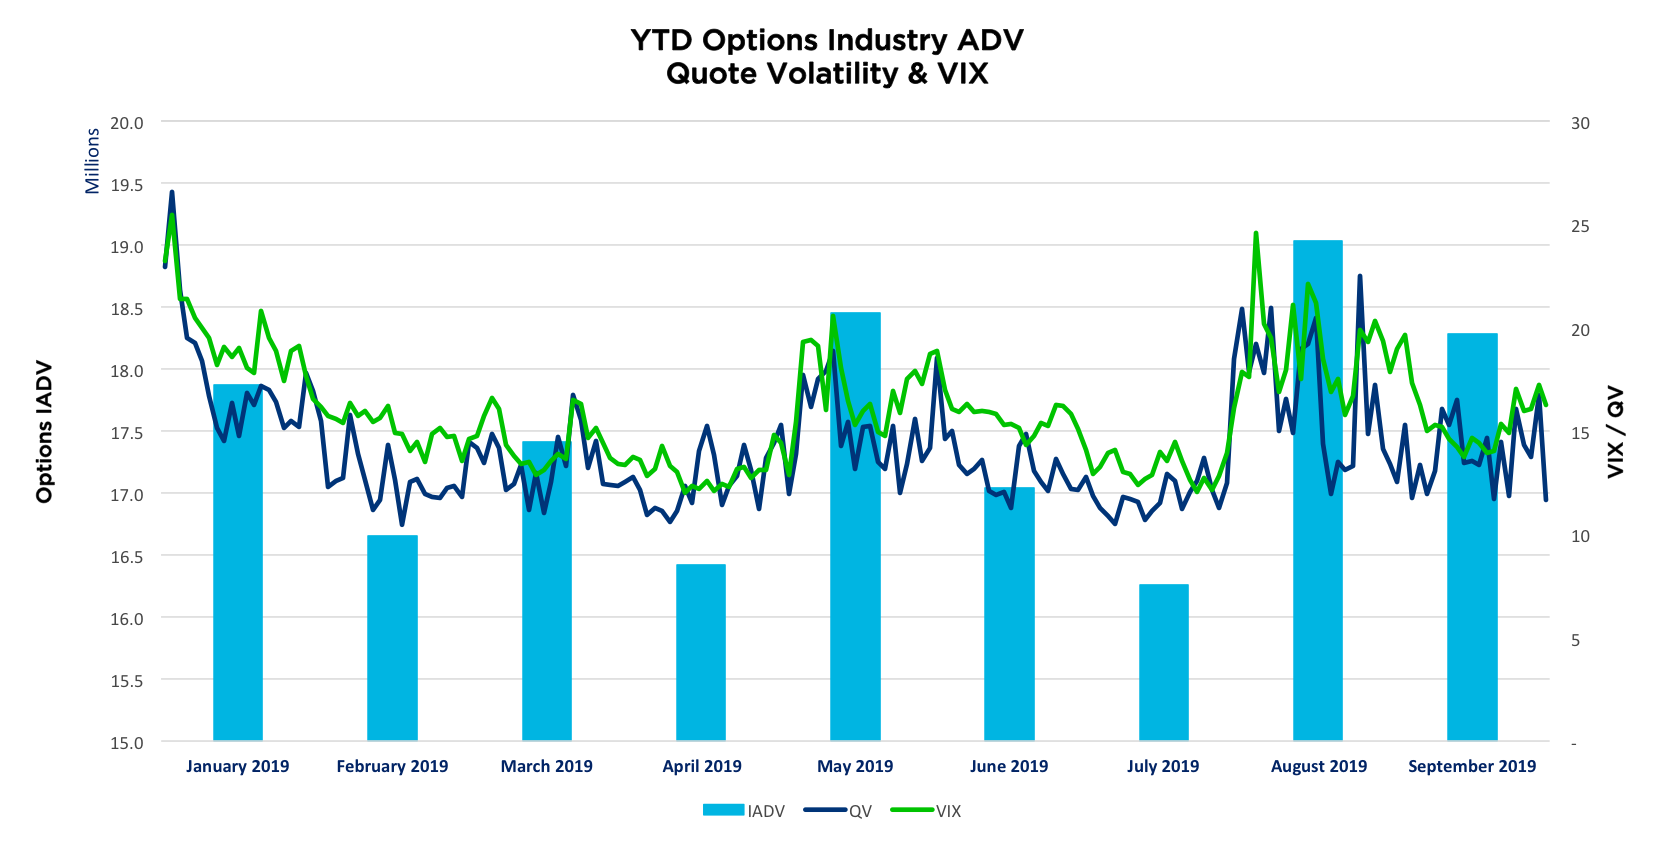
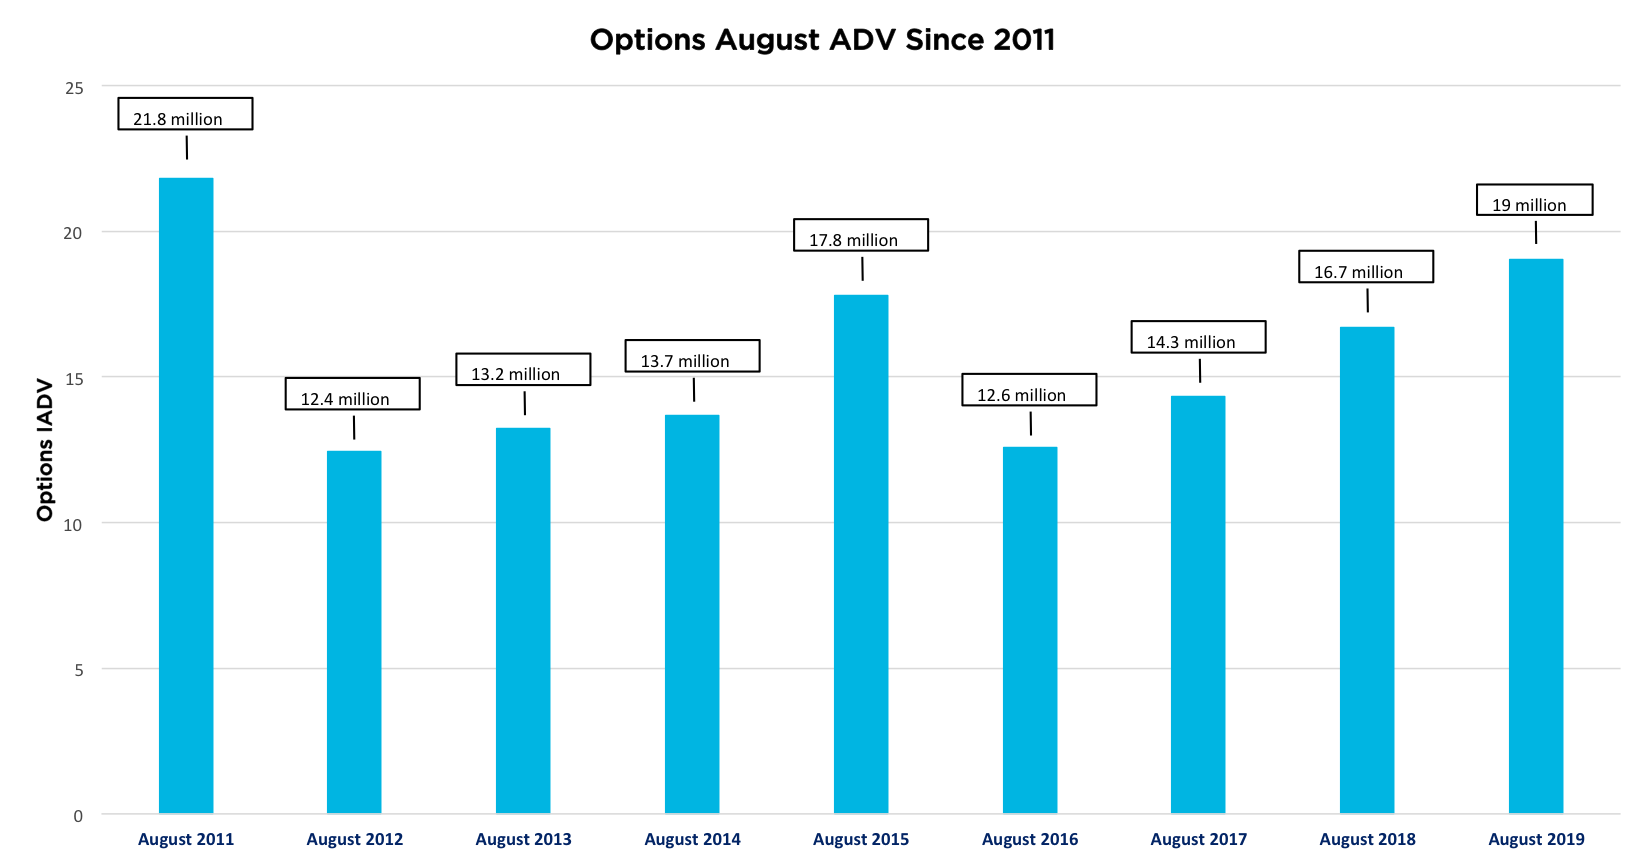
Industry Volumes
- August recorded the highest Equity and ETF Options Industry ADV since 2011 with just over 19 million contracts. The previous highest ADV month for the year was in May with 18.45 million contracts. September is 3rd with 18.34 million contracts.
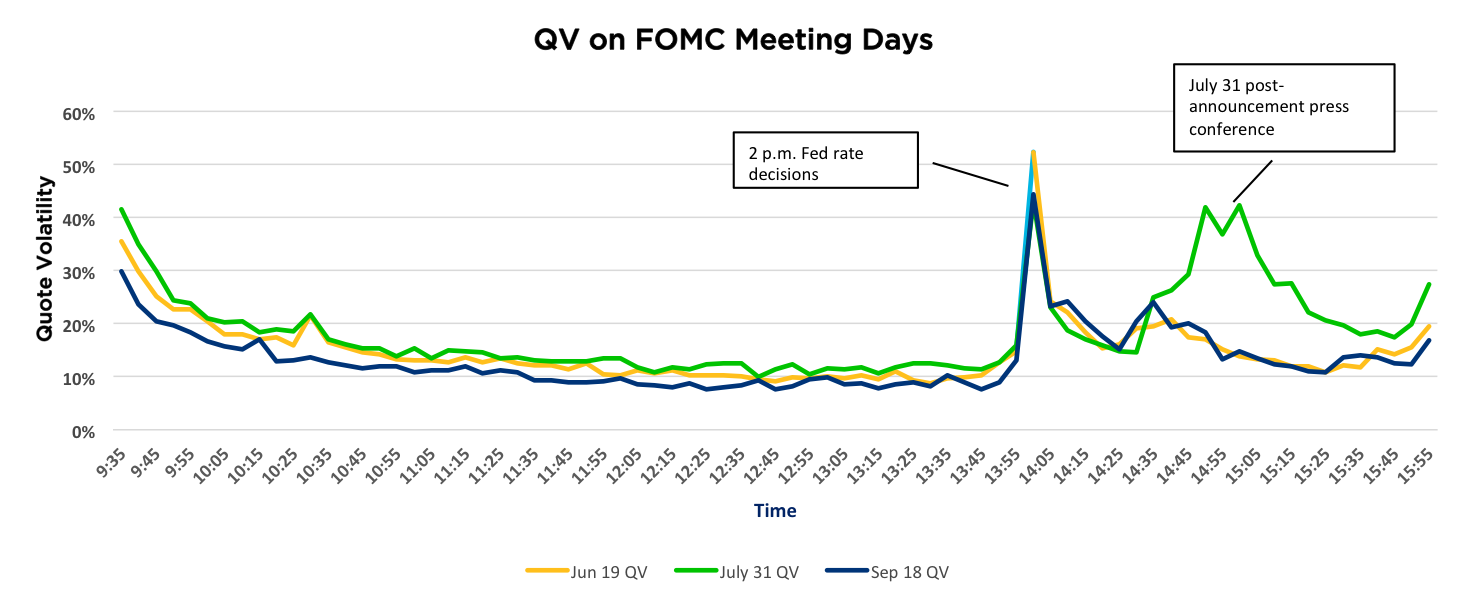
Market reactions after the Fed Meeting
- Following the previous Fed Rate cut on July 31, the Fed again decided to lower the target rate by 25 basis points on September 18. At 2:00 p.m., intraday QV leapt to 44.5, which was the 3rd highest QV spike of the six FOMC meetings this year. It was only slightly higher than the July 31 meeting which announced the first rate cut.
- September 18 post-announcement QV remained elevated similarly to the other announcements, but not at the unusually high levels recorded during Fed Chair Powell's press conference that followed the July 31 meeting.
NYSE Research Insights
Find all of NYSE Research's articles on market quality, market structure, auctions, and options.