
Options Volume on New Listings
A growing percentage of Equity & ETF options volume in Q2 2021 was driven by newly listed symbols, which we define as any symbol with options listed in the last 12 months. This figure reached a high of 13.7% (5.1 million ADV) of total industry volume in June 2021.
Figure 1
New Issue Symbol Share of Options Industry
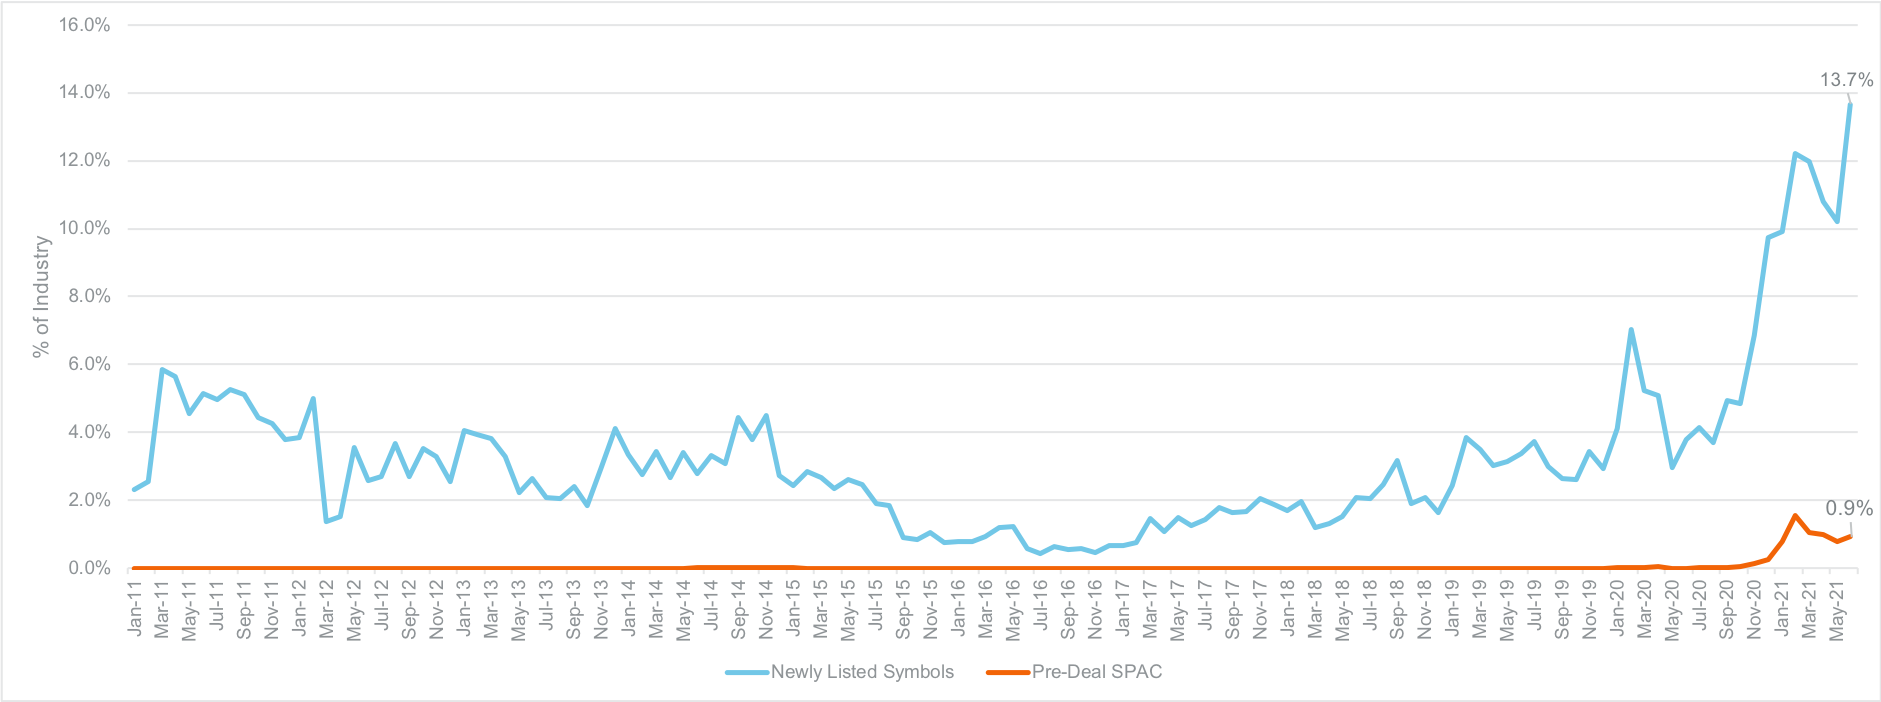
Many of the top 10 newly listed issues in June were consumer brands with a strong retail following. We also saw several pre-deal SPACs within the newly issued category, representing 0.9% (349K ADV) of total industry volume in June.
Figure 2
Top 10 New Issues
Symbol | ADV |
|---|---|
| PLTR | 411,696 |
| WISH | 373,767 |
| CLOV | 354,235 |
| RKT | 171,048 |
| CCIV | 170,337 |
| SOFI | 157,187 |
| RBLX | 119,691 |
| FUBO | 116,198 |
| ABNB | 113,537 |
| FSR | 91,936 |
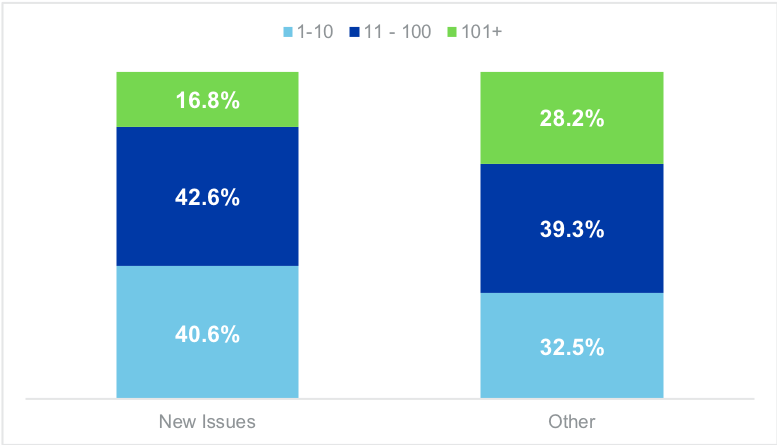
Perhaps indicative of a larger retail following, options trading in new issues had a higher proportion of smaller-sized transactions than the rest of the market. In Q2, transactions of 10 or fewer contracts were 40.6% of volume in new issues compared to 32.5% in other symbols. Conversely, transactions of greater than 100 contracts were 16.8% of volume in new issues compared to 28.2% in other symbols.
Figure 3
Transaction Size
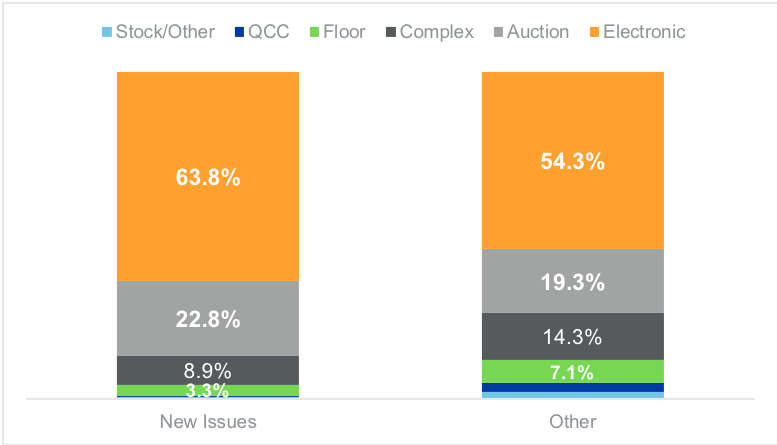
As is typical of smaller-sized transactions, a higher proportion of volume in new issues traded as electronic trades rather than on a trading floor where larger-sized transactions tend to occur. In new issues, grouping auction, complex, and electronic trades together as “electronic,” these transactions represented 95.5% of volume in new issues, with only 3.8% of such transactions traded on the Floor (Open Outcry Manual + QCC). In other symbols, excluding new issues, electronic transactions represented a slightly lower 87.9% of volume, and a higher 9.9% of transactions occurred on the Floor.
Figure 4
Trade Type
The NYSE Capital Markets team has forecast a strong IPO market in the second half of 2021. If this bears out, it should continue to provide the U.S. options markets with new issues, which in turn will support options industry volume strength for the remainder of the year.
Options Listing Process
For firms interested in trading options on new issues, listing options follows a prescribed timeline by uniform rule. The following general principles apply to listing options on all exchanges:
Day 1 - Issue begins trading on equity markets
Day 3 - After close of business, exchange regulation approves listing if the following qualifications are met:
Day 4 - Issue is certified with OCC
Day 5 - Options begin trading
For details about listing options on NYSE, see NYSE Arca Rule 5.30-O and NYSE American Rule 915.
Electronic vs Floor Volume
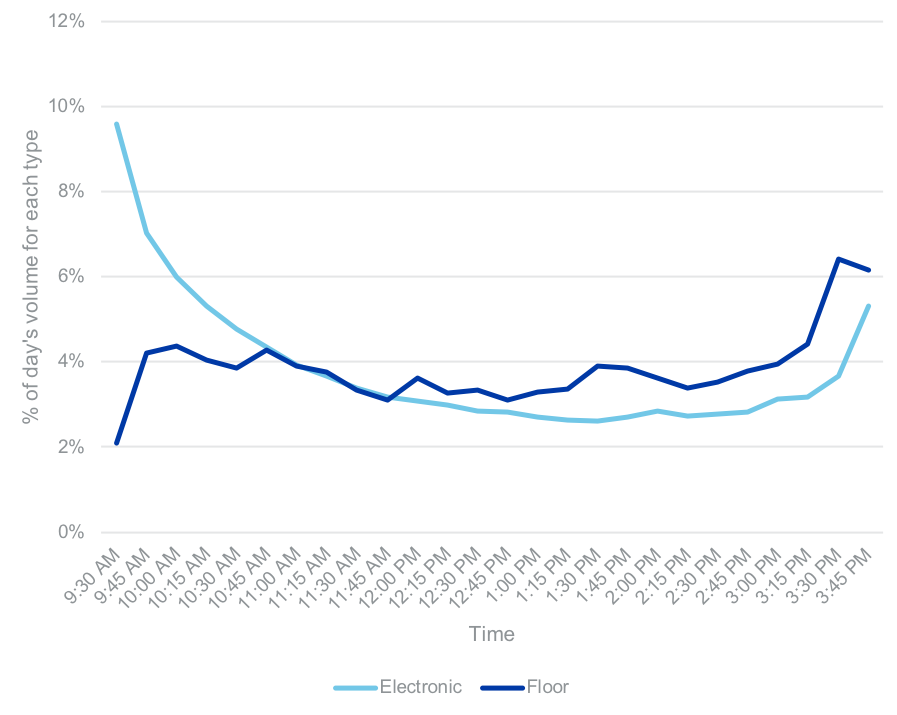
The Floors have continued to cater to larger institutional-sized transactions with an average transaction size just over 400 contracts in the first two quarters of this year. Smaller retail-sized transactions tended to dominate trading at the beginning of the day, with nearly 10% of total “electronic” volume (auction, complex, electronic) having occurred in the first 15 minutes of the day. Electronic volume trailed off the rest of the trading day before it picked up again towards the close. The average transaction size for electronic trades executed earlier in the day was 5.5 contracts , which size gradually increased to nearly 6.5 contracts per transaction by end of day. Floor volume tended to be slower than electronic volume shortly after the open and maintained a steady flow of volume throughout the trading day before it increased towards the close. Overall, transaction size increased throughout the day, driven primarily by the increased proportion of larger-sized Floor transactions.
Figure 5
Daily Volume Distribution
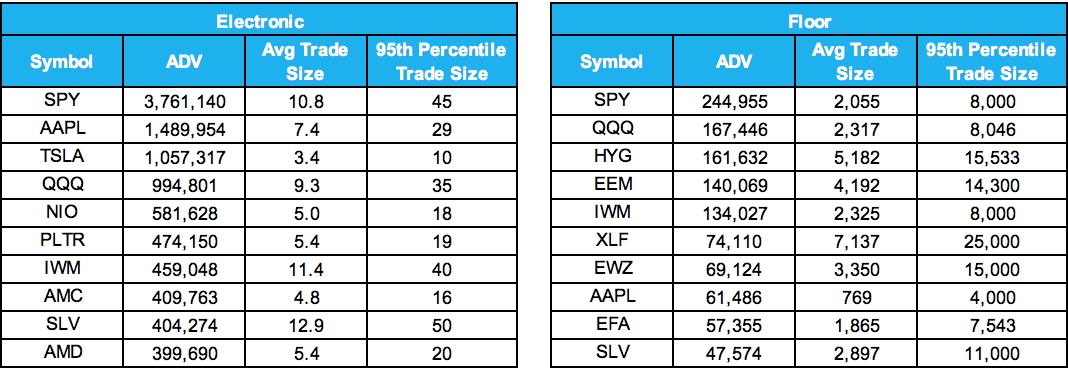
The most active symbols traded “electronically” were a mix of single stock names and ETFs. Despite the growth in new issue volume described above, only one new issue made the top 10 most-active list, highlighting the increased dispersion of market volume. In Floor trading, the most actively traded symbols were almost exclusively ETFs, with AAPL being the only single stock name in the top 10.
Figure 6
Top Electronic and Floor Symbols
Conclusion
Retail continued to drive strong volumes in the options markets in Q2, and the increased activity was particularly noticeable in new issues and retail-focused symbols. Floors continued to service larger transactions and primarily ETF names, whereas smaller-sized transactions were often executed using electronic mechanisms and included more single stock symbols.
NYSE Research Insights
Find all of NYSE Research's articles on market quality, market structure, auctions, and options.