
June 15, 2020
U.S. equity market volumes have been remarkably high since the end of February 2020 and, notably, the volume composition changes as the market moves through the current crisis. Extreme volumes in recent weeks are reportedly driven by retail traders1, leading to record off-exchange (or TRF) market share;2 5 of the 8 highest TRF market share days ever occurred in the 5 consecutive trading sessions between June 3 and June 9. With the market awash in volume, we have seen little corresponding benefit to liquidity for institutional order flow.
Volumes
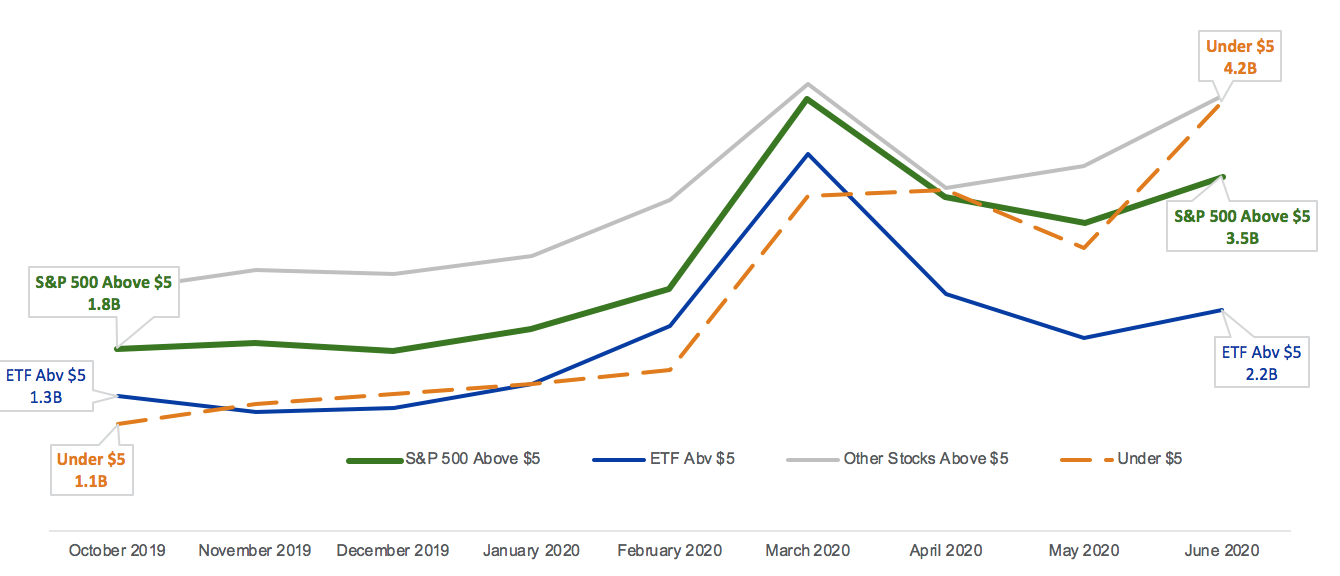
In recent days the most active securities in the market have been low-priced stocks, often affected in some way by the current macroeconomic turmoil. Additionally, though, widely held securities have seen massive, sustained volume increases. June’s average daily volume in the S&P 500 is 76% above the January 2020 average and 95% above the October 2019 average.
US Equity Market Volume, October 2019 - June 2020
Market Liquidity
Despite this huge volume increase, there is evidence that liquidity access has not improved for institutional traders.
Volume Availability
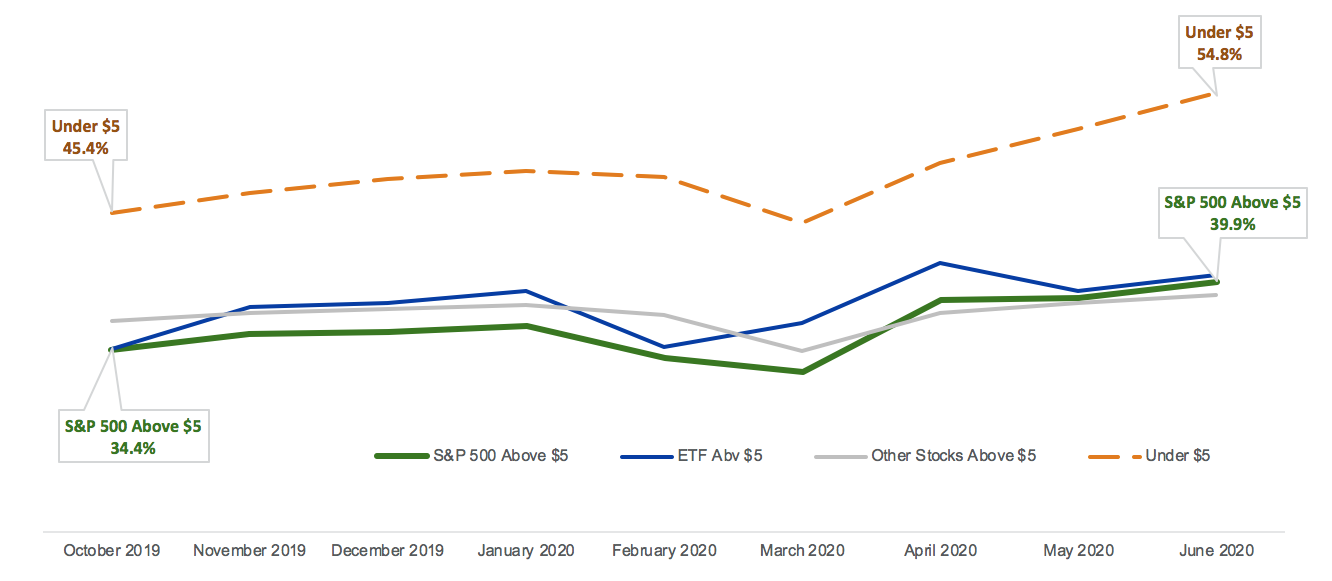
Off-exchange share of market volume in low-priced stocks is generally higher than the overall market average, and that trend has accelerated in recent weeks. Off-exchange share has also increased substantially in S&P 500 securities, rising to over 40% in June from 36% in January and 34% in October.
Off-Exchange Market Share, October 2019 - June 2020
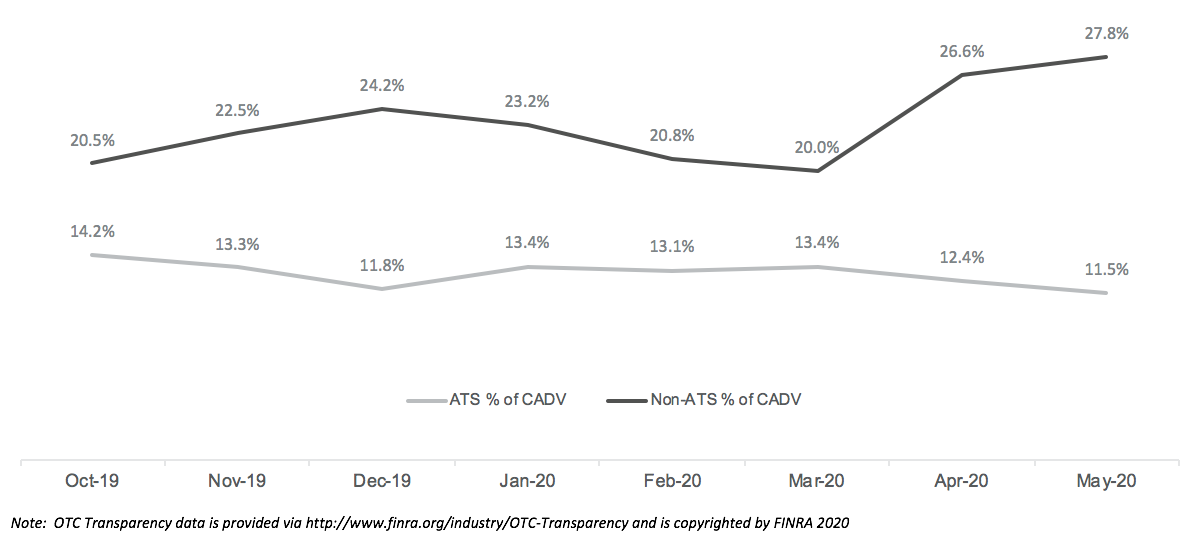
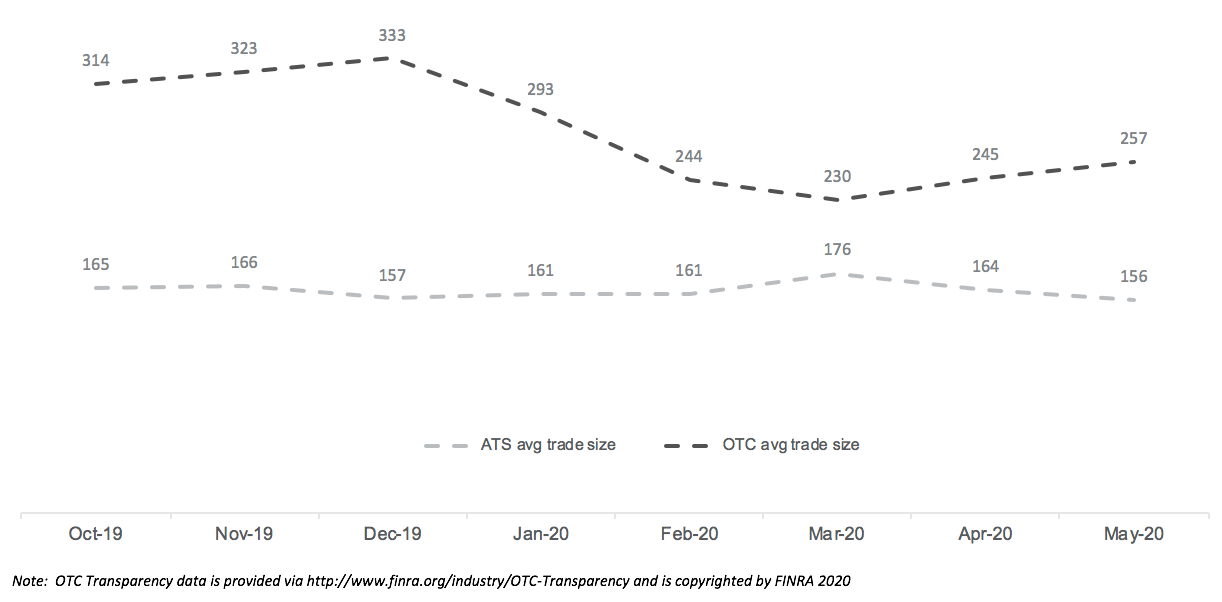
Off-exchange market share can reflect various types of trading activity, such as market makers servicing retail or institutional clients on a bilateral basis, high-touch block trading, and midpoint and full-spread trading in alternative trading systems (ATSs). The growth in off-exchange market share through 2020 has been driven largely by non-ATS activity, meaning an increasing share of trading is being conducted on an exclusive, bilateral basis. We find this to be true across the market generally and for the most widely held securities. We also observe the average trade size has fallen in recent months, suggesting that more volume has been retail-driven and relatively less has been from other sources such as block trading.
S&P 500 Share of Total Market Volume: ATS vs. OTC
S&P 500 Off-Exchange Average Trade Size: ATS vs. OTC
Market Quality
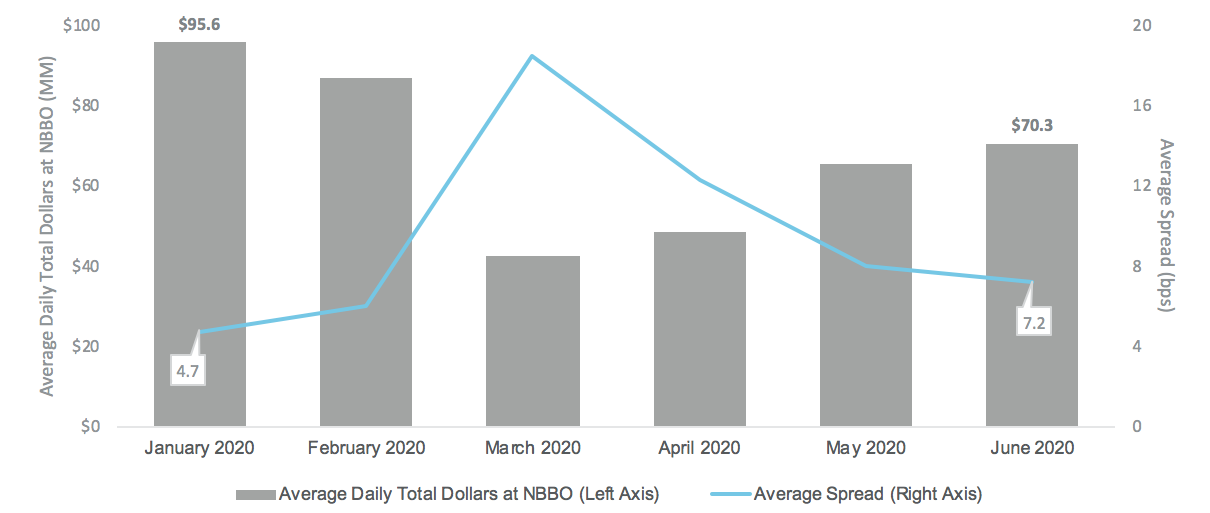
The coronavirus pandemic initiated severe market volatility, beginning in the last week of February. As expected, this volatility worsened displayed market quality indicators such as bid-ask spread and quoted liquidity. These indicators remain diminished compared to earlier in the year, even as average daily volumes continue to rise.
S&P 500: Average Notional Size at NBBO & Average Spread
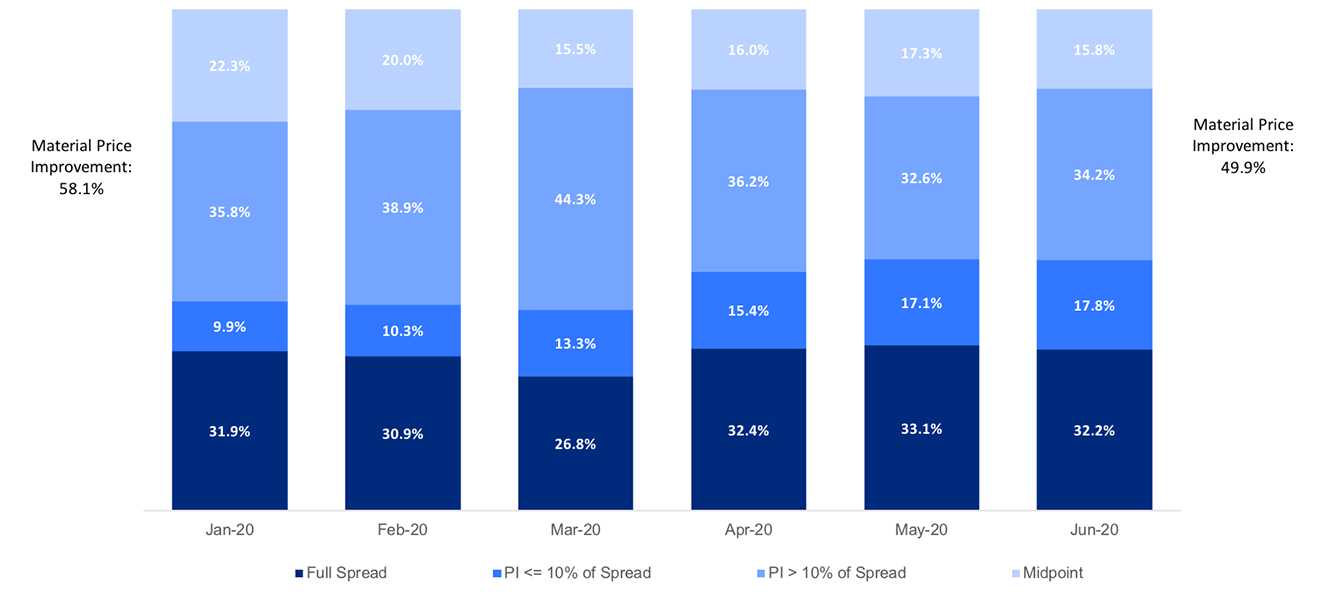
As displayed liquidity has deteriorated, off-exchange liquidity has also become less beneficial to users. We estimated off-exchange volume by fill price relative to the quote, segmenting trades by: priced at NBBO, price improvement (PI) of less than or equal to 10% of the spread, PI greater than 10% of the spread, and midpoint. As expected, and consistent with the ATS/OTC split seen above, an increasing share of off-exchange volume is trading at or near the NBBO.3,4
S&P 500: Estimated Fill Pricing for Off-Exchange Trades
Impact to Trading
In any market, higher volatility can increase trading costs for non-discretionary order flow. Today’s markets have the additional challenges of record amounts of liquidity executing on a bilateral or exclusive basis, along with diminished displayed liquidity. These effects can make choosing a strategy and measuring performance more difficult: if nearly 28% of S&P 500 volume trades away from both exchanges and ATSs, what does a “10% volume participation” metric really mean?
1 Wall Street Journal, Individuals Roll the Dice on Stocks as Veterans Fret, June 9, 2020
2 Retail brokerages send much of their order flow to market makers, who can execute off-exchange and report the trade to the Trade Reporting Facility (TRF).
3 Includes all regular hours, regular-way trades of at least 1 round lot reported by the TRF.
4 Given potential latencies with off-exchange trade reporting, we checked this trend by measuring TRF volume by prices at increments of full penny, one-half cent, and sub-penny. We find that volume with one-half cent increments declined from 29% of TRF volume in January to 21% in June.
NYSE Research Insights
Find all of NYSE Research's articles on market quality, market structure, auctions, and options.