July 26, 2019
We recently introduced Quote Volatility (QV), a new flexible metric to measure volatility, and its correlations to changes in execution venue selection.
Our previous post used the Federal Open Market Committee’s (FOMC) interest rates decision last December as a case study on the QV’s application. With indications of more accommodative monetary policy from Chairman Powell, we took a deeper look at QV reactions following the four Fed rate decisions in 2019.
We found that QV at the time of the Fed announcement is on average 3.5 times higher than usual, which impacts both market volume and exchange activity.
Year-to-Date FOMC Meetings
The FOMC has eight scheduled meetings each year, and we looked at QV on the four FOMC rate decision days to date: January 30, March 20, May 1, and June 19.
Rate decision announcements occur at 2 p.m., and the analysis showed that on those four days, QV of OEX (S&P 100) components increased by an average of 217% in the 2:00:00-2:04:59 period compared to the preceding 5-minute period. The QV increases at 2 p.m. ranged from a 72.9% increase for the May 1 meeting to a 255% increase for both the January 30 and June 19 meetings. By comparison, QV only increased by 17.7% at 2 p.m. on all other trading days (excluding the four FOMC meetings) in the first half of the year.
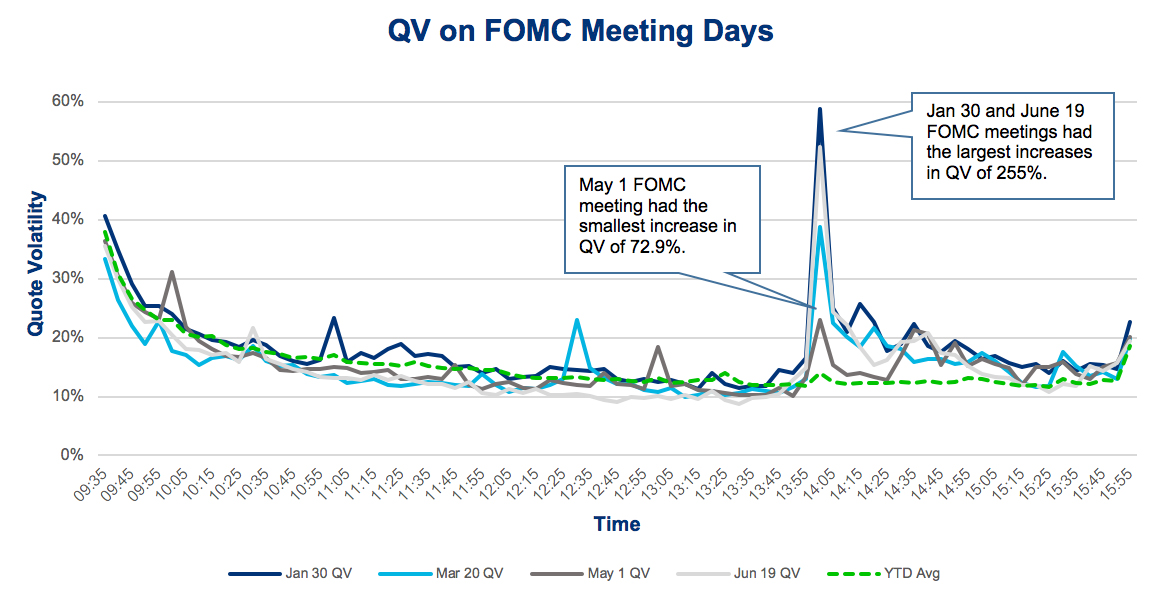
Markets widely expect the Fed to lower rates by at least 25 bps at the upcoming July 31 meeting. This expectation is similar to June, though to the surprise of markets, the Fed decided to leave rates unchanged. As noted earlier, QV spiked 255% following that June decision, which matched January’s meeting as the largest change in QV so far this year.
QV Pre-and Post-Fed Announcement
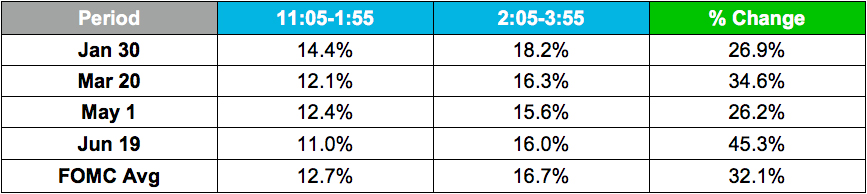
As the QV curve demonstrates, QV remained elevated after the Fed announcements. To properly compare pre- and post-announcement QV, we excluded the first 90 minutes of trading as well as the final five minutes of regular trading in the day, as those time periods follow a clear daily pattern of changing QV.
One can see an intraday pattern where QV steadily drops from the opening auction through the end of the first 90 minutes before stabilizing at around 11:05 a.m. Year-to-date (including the four Fed dates), QV dropped 58% from 9:35 a.m. to 11:05 a.m., and QV spiked 46.9% from 3:50 to 3:55 p.m.
Having excluded these two time periods, it gave us more stable periods in the day to compare around the Fed decision. The average QV after the rate decision announcement was 32% higher than before the announcement.
Venue Selection
In our previous blog post introducing QV, we found that venue selection was affected by the FOMC rate decision in December 2018. Specifically, TRF market share dropped at the time of the announcement and then remained lower to the close. We observe similar impact to venue selection in the four FOMC days in 2019 compared to the average 2019 trading day.
On the four FOMC dates, TRF share dropped from 41.9% ten minutes before the announcement to 16.5% immediately following the announcement. TRF share remained slightly lower at around 30-35% compared to about 40% before the announcement. On an average trading day, TRF share remained fairly steady until the time periods approaching the close.
Trading Volumes
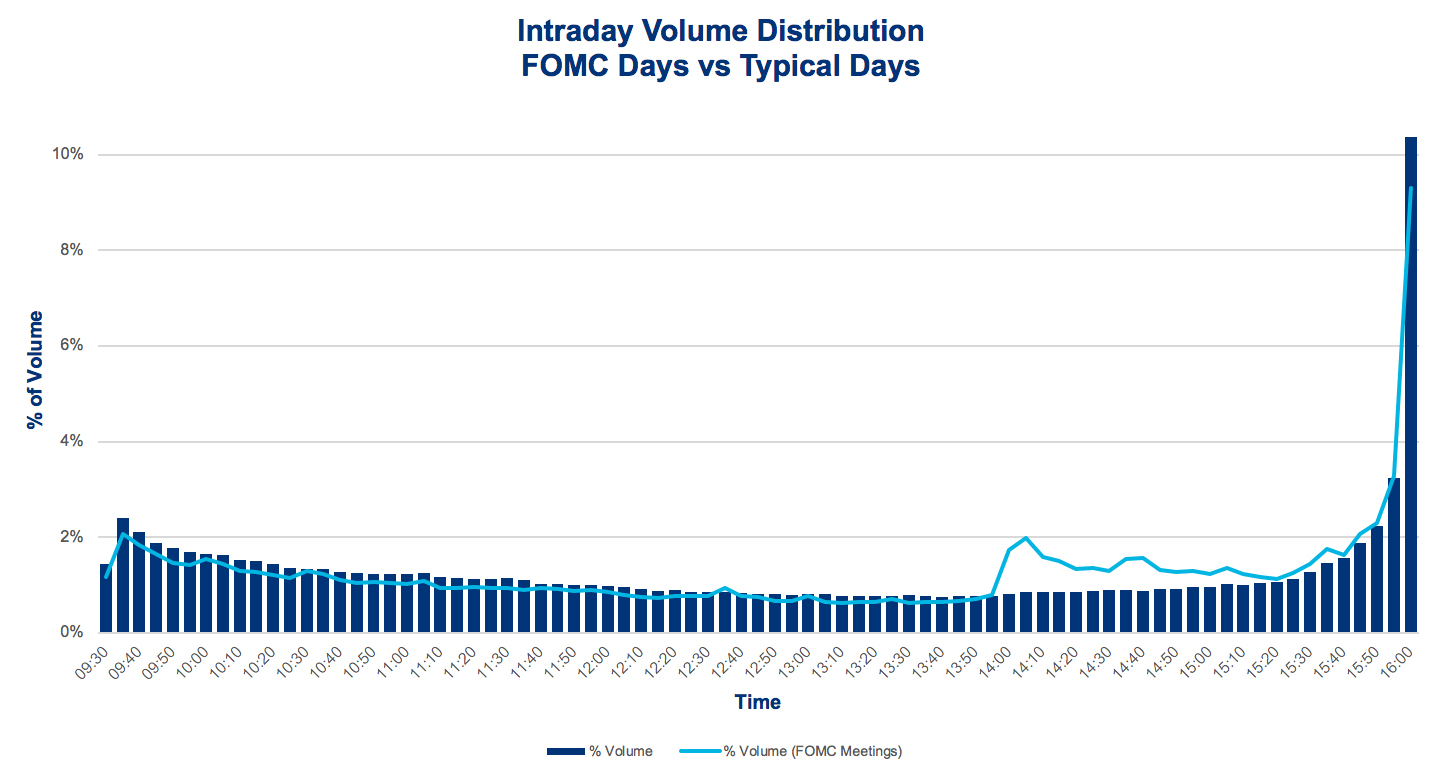
Intraday volume on FOMC meeting days closely tracked typical trading days from the open until just before the 2 p.m. announcements, when activity spiked higher. Average consolidated volume on the four FOMC meeting days was only modestly higher than the average trading day with about 7.5 billion shares compared to 7.2 billion shares through the first half of the year. These volume levels and distributions suggest that these events do not dramatically increase trading activity or offer substantially more liquidity than standard days.
Summary
So far in 2019, Fed announcements have caused dramatic but short-lived increases in the QV measurement and only modest changes in overall market volume. The forthcoming announcement on July 31 has received substantial attention, and therefore, we anticipate above-average changes in market conditions, including QV, volume and off-exchange trading activity.
NYSE Research Insights
Find all of NYSE Research's articles on market quality, market structure, auctions, and options.