
March 30, 2021
Kevin Tyrrell, Head of Research, NYSE
The boost in retail trading activity which began during pandemic lockdowns in spring 2020 continues today. This trend has impacted various market behaviors, including opening auctions. We have covered how NYSE Opening Auction liquidity has grown due to small order sizes. Below we examine auction volume interest by sector and highlight changing trends in order entry behavior.
Auction Interest by Sector
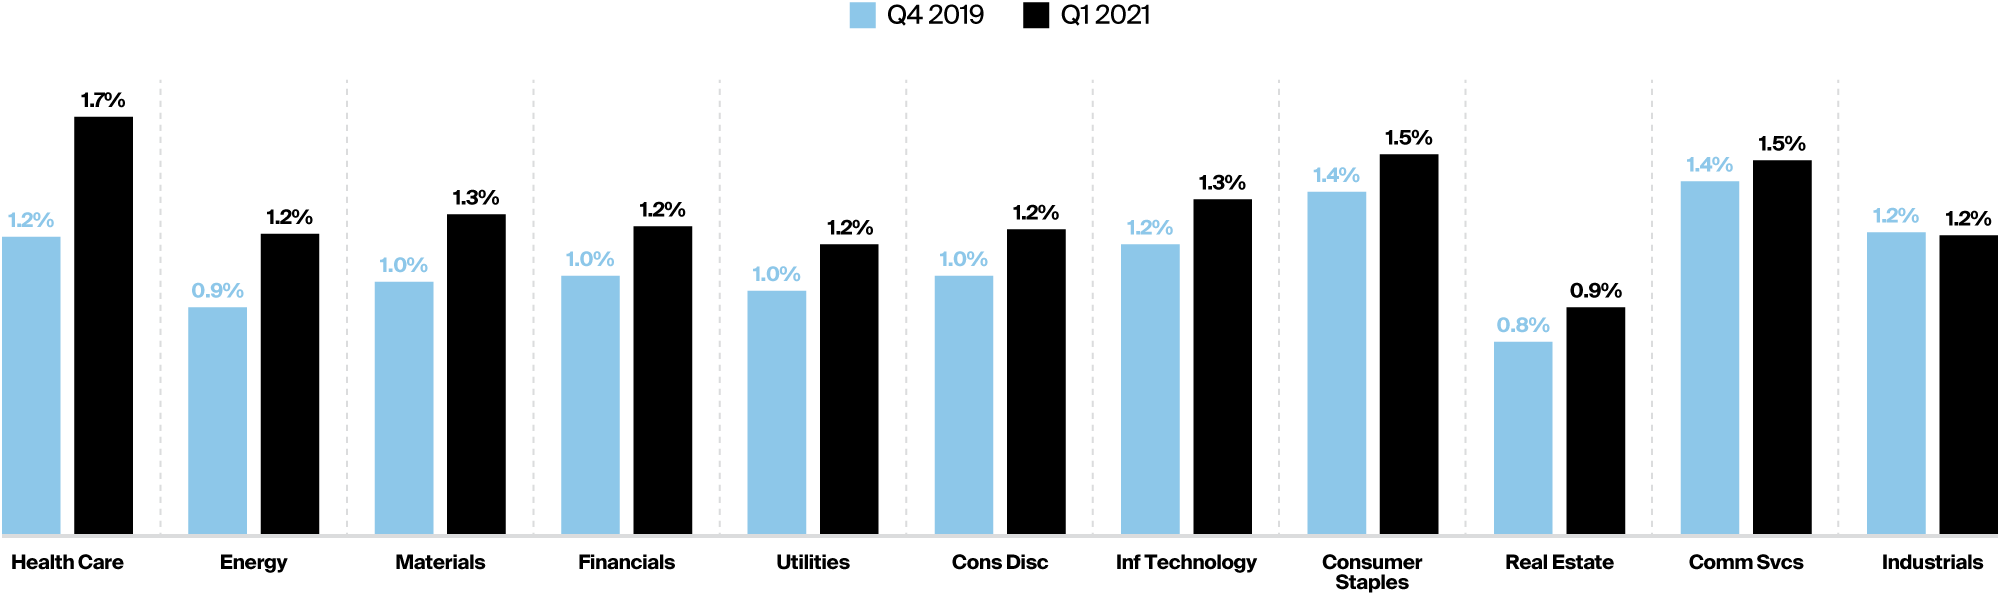
Opening auction interest has grown across nearly all sectors.
- For NYSE-listed stocks in the Russell 1000 index, Health Care stocks have added about 50bps to the share of volume executed in the Opening Auction since Q4 2019.
- Energy and Materials have also seen auction growth; the only sector without growth is Industrials with a de minimis decline.
Opening Auction Share of Total Market Volume
NYSE-Listed Russell 1000 Stocks
With the growth in retail trading and associated off-exchange volume, NYSE Opening Auction liquidity has become a more important vehicle for accessing retail liquidity.
- The Opening Auction has grown to trade 58MM shares per day, compared to 47MM in December 2020 and 30MM in December 2019.
- Volume has grown even as market prices rise: the auction’s volume-weighted average price is up 2.3% from December 2020 and 7.8% from December 2019.i
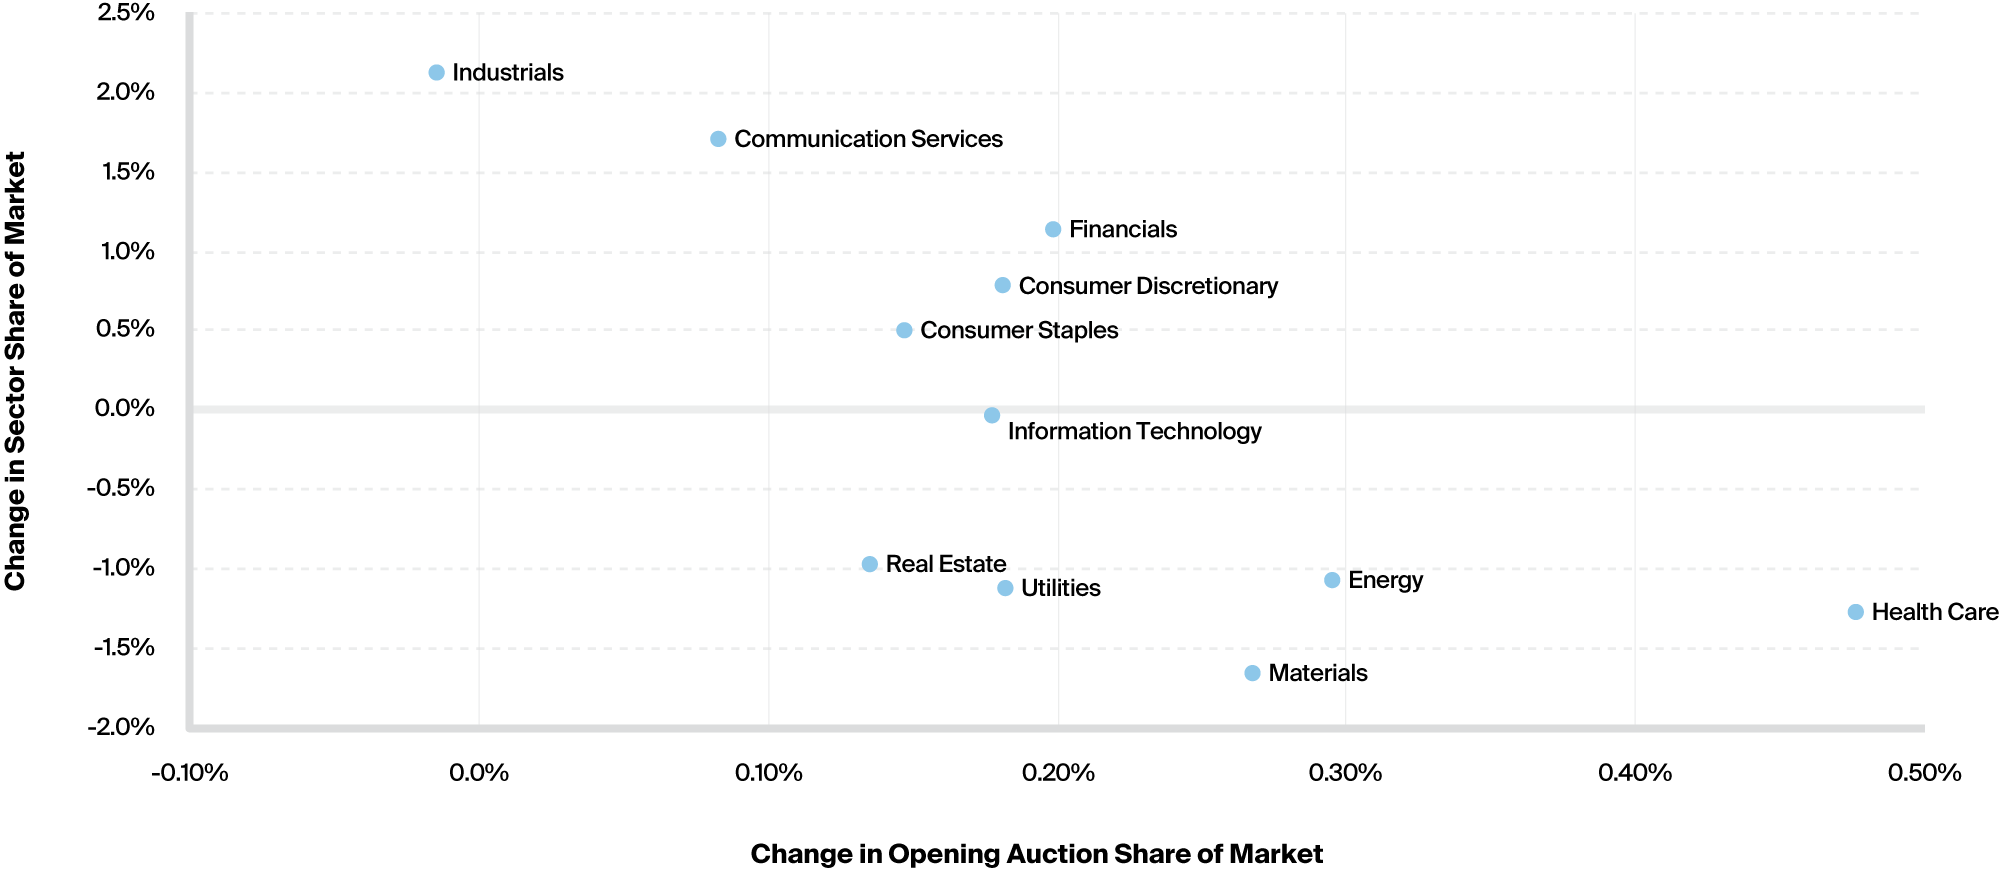
- Despite off-exchange volume growing, the auction has maintained total market share of 1%-1.2% of total NYSE-listed market volume.
- In fact, sectors that have seen relatively less market volume growth have tended to have more growth in Opening Auction share.
Sector Share of Market Volume vs. Opening Auction Share of Total Volume
NYSE-Listed Russell 1000 Stocks
Auction Matching Occurs Earlier
As the Opening Auction has grown, we have seen similar amounts of overnight volume but faster growth in paired shares during the auction periodii compared to Q3 2020.
- This month, 6.6% of executed auction volume was entered before 8:00 AM, compared to 6.8% in September 2020.
- Aggregate volume entered during the auction period (8:00 AM - 9:30 AM) follows a similar pattern to previous months.
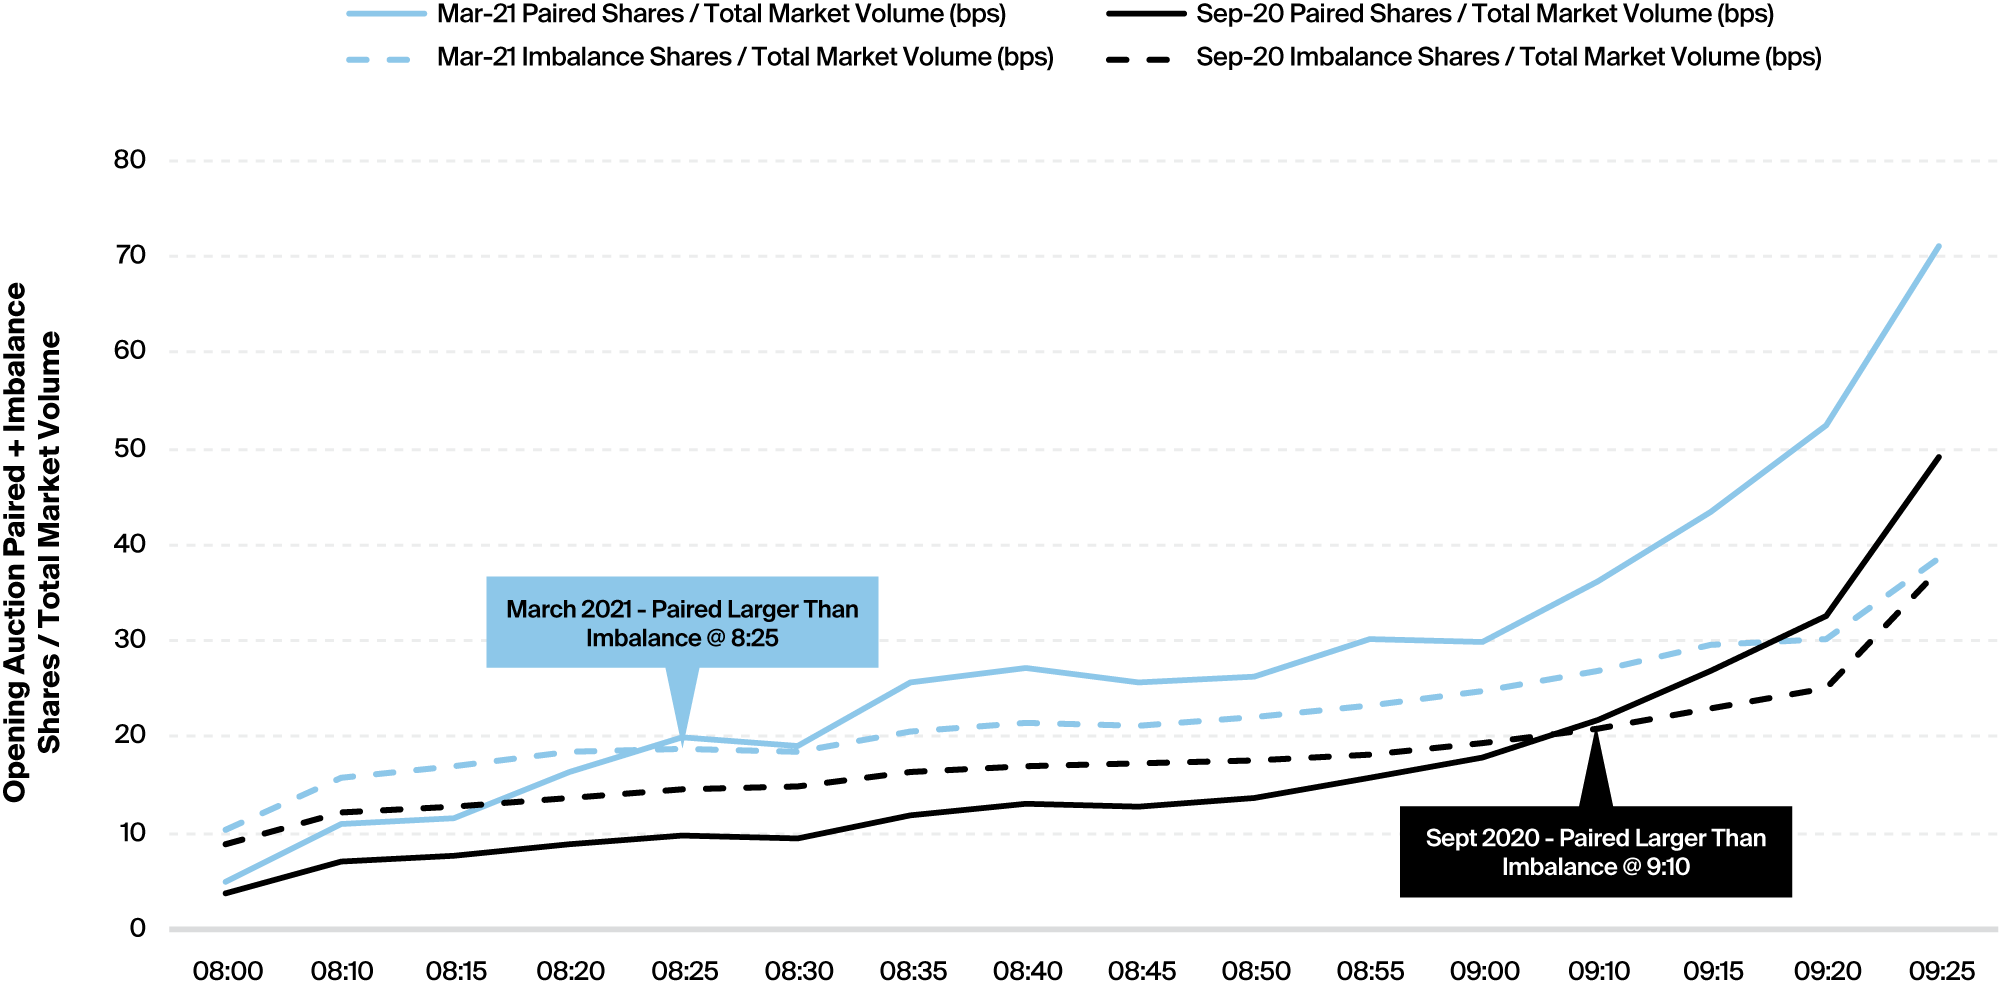
- Importantly, paired shares are now a larger portion of the auction interest through more of the imbalance period.
- This suggests that “natural” flow entering the opening auction (i.e., flow looking to open/close a position) is now more balanced between buy and sell interest compared to previous months.
- While flow is entering earlier than previous months, there is still an increase in imbalance quantity in the last few minutes before the auction as later-arriving orders are added to the auction.
NYSE Opening Auction Timeline: Paired & Imbalance Shares Leading to Auction
NYSE-Listed Russell 1000 Stocks
Liquidity Insight and Opportunity
The NYSE Opening Auction executes 58MM shares and $2.8bn in notional value each day, excluding expirations, and has grown market share as retail trading and off-exchange volume has risen. As Opening Auction interest has shifted to earlier in the morning, paired and imbalance volume data can offer better views into liquidity opportunities and a unique source of accessible liquidity.
NYSE Research Insights
Find all of NYSE Research's articles on market quality, market structure, auctions, and options.