
January 18, 2021
By all accounts, 2020 was extraordinary for options trading. The year began as a continuation of two straight record years for options volumes and growth that would only continue and accelerate. Case in point: the top 10 multi-list equity and ETF volume days all came in 2020, as did 23 of the top 25 days. Previously, multi-list volume had never breached 40 million contracts, and yet all top 10 volume days for 2020 exceeded that 40 million mark.
This trend has thus far continued into 2021. On January 15, 2021, a new record high was set for daily multi-list volume (48.3 million contracts), which smashed the previous record set just the week prior by nearly 3 million contracts. Including the new record, the 2nd, 4th, and 6th highest days ever were all recorded in these first weeks of 2021. The highest recorded weekly options volume occurred in the second week of trading in January 2021, and the next highest weekly total occurred in the first week.
Amidst the volume records in 2020, there was a significant market drawdown and intense volatility as Covid-19 became a global pandemic that temporarily closed options trading floors. Market quality was most affected in March as quoted spreads widened by 118%, and posted size declined by 46%. As 2020 wore on, employees adapted to working remotely, and the options markets experienced increased growth levels fueled by retail investing, even as institutional-sized trades pulled back.
While NYSE Trading Floors (and other options trading floors) were closed at the end of Q1 through the beginnings of Q2, some open outcry options volume shifted into electronic auction mechanisms. Even after trading floors reopened, auction mechanism usage remained high and exceeded pre-pandemic levels, primarily due to the increase in retail volume.
The market quickly bottomed at the end of Q1, and a strong market rally began even as volatility remained elevated. In Q2, market quality began to recover and Call-Put (C-P) ratios flashed more bullish signals as forward-looking expectations of economic recovery became consensus sentiment. The C-P Ratio rose to a high in December of 1.9 from a low in March of 0.9. Led by large cap tech, the market rallied and eventually achieved new highs in the major indices. In Q3, two high-priced names, AAPL and TSLA, split their shares, which had a positive impact on options volumes.
Finally, in November, the country had a U.S. Presidential election during a global pandemic with a record amount of early and mail-in voting. The results were not known immediately following election day, and an electoral college winner would take weeks more to declare as votes continued to be counted in some close races. While this sowed uncertainty, the election was quickly followed by positive vaccine news and potential for additional fiscal stimulus, which led to increased investor confidence and drove the market even higher.
Record Volumes and Market Quality
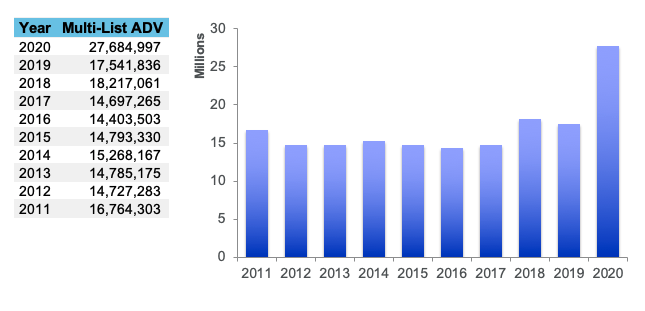
The year 2020 was truly a new paradigm for options markets as the industry saw multi-list equity and ETF ADV exceed the next highest year by over 50%.
Annual Multi-List ADV
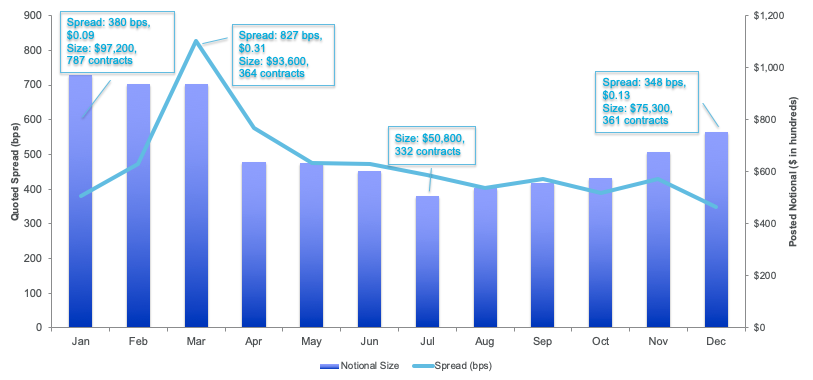
Options market quality was adversely impacted as volatility intensified at the end of Q1, when the U.S. first felt the impact of Covid-19. Quoted spreads were the first to recover as the market rallied, while posted liquidity has yet to reclaim pre-pandemic levels, and continues to recover at a relatively slow rate. Quoted spreads measured in basis points are now narrower than they were pre-pandemic. Posted notional size has increased by 35% from the end of Q3 to the end of Q4, but remains low relative to Q4 2019.
Quoted Spread (bps) and Posted Notional Size
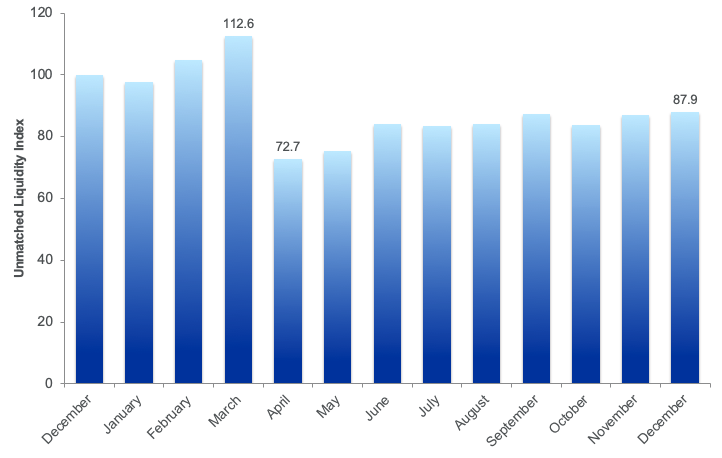
NYSE created the Unmatched Liquidity Index which is another measure of liquidity that tracks the ratio of “unmatched volume” (non-auction and non-QCC volume) to “pre-matched volume” (auction and QCC volume). This metric has shown much slower recovery compared to quoted spreads and posted size due to the sustained usage of auction mechanisms.
Unmatched Liquidity Index
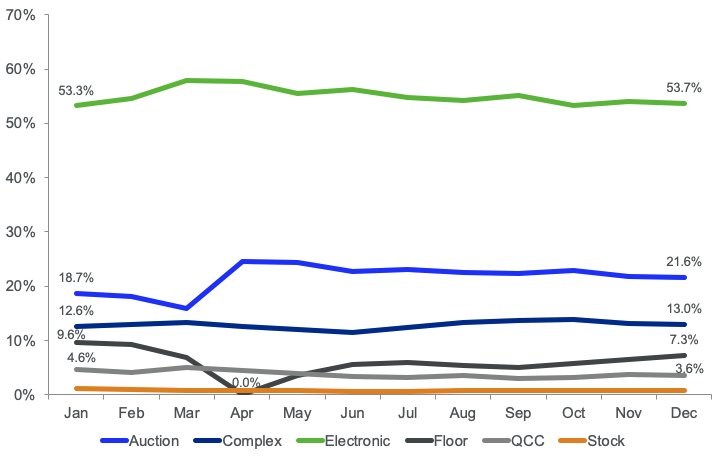
Electronic auction volume finished the year at 21.6% of options volume compared to 18.7% at the start of 2020. Trading Floor volume recovered late in the year to 7.3% share, despite Covid-19 related floor closures in December, compared to 9.6% share at the beginning of the year.
Trade Type Mix
Volume Concentration
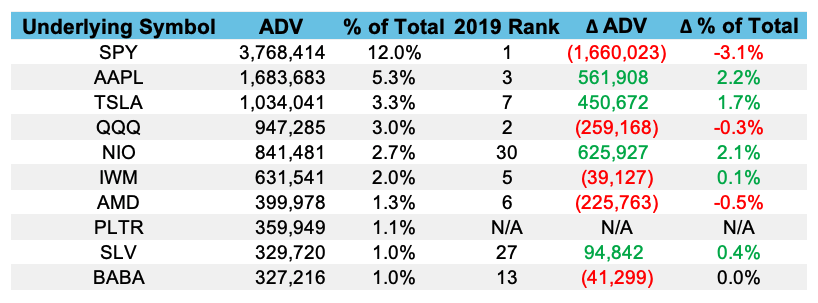
SPY concentration reached an all-time high in March 2020 at 24.6%, as markets sold off rapidly due to the pandemic. By December 2020, some sectors of the market rallied more rapidly than others, and SPY concentration dropped to its lowest level since January 2011 at 10.6%. Following the high-profile splits of AAPL and TSLA, options volumes in these underlying symbols increased, and now represent a more significant share of overall options volume.
Top Symbols Q4 2020 vs 2019
Conclusion
Thus far in 2021, the options industry saw new daily and weekly multi-list options volume records, in which both records were subsequently broken the following week. Increased level of retail investor engagement show few signs of slowing down. NYSE Options expects strong options volumes to continue at least through the early part of 2021. NYSE Options will continue to monitor liquidity metrics and market expectations related to the economic recovery from the pandemic.
NYSE Research Insights
Find all of NYSE Research's articles on market quality, market structure, auctions, and options.