
Recents
2023: The Year in U.S. ETPs - Part 32023: The Year in U.S. ETPs - Part 2Closing auction order impact2023: The Year in U.S. ETPs - Part 1Trends in options tradingClosing Auction: Immediate market impact, price drift and transaction cost of trading Part 2The shifting dynamics of the NYSE Closing Auction: An inside viewThursday, Feb. 01, 2024
2023: The Year in U.S. ETPs - Part 3
2023 was an extraordinary year in global equity markets, with U.S. markets out-performing most foreign markets and a small group of technology stocks, as evidenced by the NYSE FANG+ Index, helping the S&P 500 rally more than 25%1 to at or near record levels depending upon the index. The broader index trailed substantially and did not show strong gains until the fourth quarter. The difference in returns between the S&P 500, which is market capitalization-weighted, and its equal-weighted version was the largest ever. The small cap S&P 600 was down through the first three quarters of the year, before rallying 16% in the fourth quarter.
Chart 1: U.S. Equity Index Performance2
Given the wide range of returns in the U.S. equity market, we review the flows and performance of the many ETP equity market categories.
Equity Returns
Several narrow thematic equity ETPs led the way in returns for 2023, including Blockchain, Next Generation Internet and Fin Tech, all returning more than 60% for the year and topping 25% gains in the fourth quarter. However, despite this strong performance, the latter two suffered outflows for the year.
For broader based products, U.S. Info Tech, Communications, Consumer Discretionary and Large Cap Growth all returned more than 40% in 2023. However, in Q4 Communications returns of 11.1% and Large Cap Growth at 12.9% trailed Info Tech and Small Cap stocks as the rally broadened on expectations of the Fed pausing and possibly starting to lower rates in 2024.
Chart 2a: Top 5 Thematic Equity ETP by 1-year Return3
Chart 2b: Bottom 5 Thematic Equity ETP by 1-year Return
Despite strong returns for the year, three of the top five narrow groups -- Next Generation Internet, Fin Tech, and Multi-Trends -- saw outflows in 2023. Conversely, two of the bottom five saw inflows: Cannabis and Tomorrow’s Treatments. Only the Multi-Trends ETPs were in the top five by AUM, and none of the narrow-themed products account for more than 0.52% of total Equity AUM for U.S.-based ETPs.
Broader ETPs, while offering less targeted choice, provide greater diversity and still can offer strong returns. All of the top five broader groups had full year inflows while four of the bottom five had outflows (“uncategorized” had small inflows). Consumer discretionary suffered a small outflow during the last quarter of 2023.
Chart 3a: Top 5 Broad Equity ETP by 1-year Return
Chart 3b: Bottom 5 Broad Equity ETP by 1-year Return
Leveraged and Inverse Products
Leveraged and inverse ETPs are generally employed as short-term tools, allowing investors to either hedge or amplify returns when they expect a significant market move. Their design makes them less well suited as long-term investments because their returns are geometric. For example, the S&P 500 SPDR ETF (SPY) gained 25.83% for the year, while a 2X bull ETP gained just 46.34%, well below two times the return of the non-leveraged ETP .
Much like overall stock market activity, volume in leveraged and inverse ETPs increase when the market falls and decrease when the market rallies. The correlation between the change in volume and the change in SPY price was -0.17 for leveraged and -0.18 for inverse; volume rose when prices dropped. There was a very strong 94% correlation between leveraged and inverse volumes, as price direction had the same impact whether the products were bull or bear focused.
Chart 4: Leveraged and Inverse ETP Volume in Millions vs. SPY
(5-day moving average)
Foreign Stocks
Foreign stocks were mixed in 2023. The smallest emerging markets -- frontier exchanges -- only managed single digit gains, while Latin America, Mexico and North America (which includes the U.S.) ETPs returned more than 30%, ahead of U.S. stocks.
Most global stock markets under performed U.S. equities in 2023, with returns between 10% and 20%. Multiple geographies had fund outflows in 2023, led by $664 bn exiting the U.K. and $581 bn leaving the combination of China and Hong Kong. When measured as a share of year-end AUM however, Germany at -33% and Frontier Emerging Markets at -25% experienced the largest outflows.
Non-U.S. Equity Market ETP Flows, AUM and Returns
| Geographical Focus | Flow ($mn) | AUM ($mn) | Wtd 3-mo Return | Wtd Q1-Q3 Return | Wtd Return 1yr |
|---|---|---|---|---|---|
| Other Developed | $40,158.6 | $524,696.2 | 10.6% | 5.6% | 16.8% |
| World/Other | $17,020.9 | $418,528.9 | 12.8% | 7.9% | 21.8% |
| Emerging Mkts. | $14,028.9 | $241,409.7 | 7.5% | 2.5% | 10.2% |
| Developed Europe | $3,348.8 | $40,747.0 | 12.1% | 6.6% | 19.6% |
| Japan | $6,209.2 | $29,753.3 | 7.2% | 13.6% | 21.8% |
| North America | $311.8 | $23,623.0 | 10.5% | 23.3% | 36.2% |
| China/Hong Kong | $580.8 | $22,887.4 | -4.1% | -10.6% | -14.3% |
| India | $4,359.9 | $12,577.5 | 10.3% | 8.3% | 19.5% |
| Developed Pacific | $126.1 | $10,629.3 | 10.2% | 2.7% | 13.2% |
| Canada | $484.0 | $10,191.9 | 11.2% | 2.6% | 14.1% |
| Brazil | $80.9 | $6,649.5 | 17.9% | 11.9% | 32.0% |
| South Korea | $761.9 | $4,638.2 | 14.2% | 3.8% | 18.5% |
| Asia/Asia Pacific | $181.8 | $4,107.3 | 7.9% | -1.5% | 6.3% |
| UK | $664.3 | $3,387.0 | 7.2% | 5.0% | 12.6% |
| Europe | $132.1 | $2,435.6 | 9.9% | 10.2% | 21.0% |
| Mexico | $701.1 | $2,163.8 | 18.8% | 16.3% | 38.1% |
| Latin America | $657.3 | $2,003.4 | 17.1% | 12.6% | 31.8% |
| Switzerland | $388.4 | $1,404.4 | 10.9% | 4.7% | 16.2% |
| Germany | $388.4 | $1,179.3 | 13.1% | 7.4% | 21.4% |
| Emerging Frontier | $242.0 | $951.2 | 3.9% | 3.0% | 7.0% |
| Israel | $48.7 | $380.7 | 7.7% | -1.4% | 6.2% |
| Europe,US | $39.4 | $43.2 | 14.2% | -5.1% | 8.4% |
- Based on the S&P 500 Index
- Source: NYSE Research
- All flow, return and AUM data source Track Insight
- Consider a 2X leveraged bullish equity fund. If the stock market rises and falls 1% for 50 consecutive days, the fund will lose 1% of its value. Without leverage it would lose 0.25%. Your losses are 4X. The way to look at this is each day the value of the fund rises or falls by the index multiplied by its leverage factor. One day down 2% (1% time two) means the fund falls 2%, then if it rises 2%, instead of being down 0.01%, you will be down 0.04%: 100*.98*1.02 = 99.96. If there is a very large move this can lead to very large losses.
- SPY has an expense ratio of 0.10%, the 2X ETP 0.75%. The return difference is far larger than the expense difference. Leveraged funds tend to have somewhat higher expense ratios as they are more complex and costly to manage.
- Track Insights geographical categories include several combination categories, including North America, which includes the U.S., Asia, Asia Pacific, Developed Markets and others. An ETP can only be included in one group.Due to the large number of groups, we present the summary data in tablular format.
- We limited data to geographical categories with at least three ETPs.Returns are AUM weighted by ETP symbol.
Wednesday, Jan. 17, 2024
2023: The Year in U.S. ETPs - Part 2
Last week we summarized 2023 big picture trends in U.S. ETPs. While the two largest categories in terms of assets under management (AUM) and volume are equity and fixed income ETPs, three important stories were around the growth in actively managed products, the loss of momentum in ESG ETPs, and the drama around approval of listed spot cryptocurrency from the SEC.
Actively Managed ETPs
Actively managed ETPs continued to attract strong interest in 2023. Although only representing 6.6% of total ETP AUM, these products garnered $137.2 bn in flows - 22.5% of total flows for the year1. More than 1/3 of all U.S. listed ETPs are now actively managed.
There are three basic types of actively managed ETPs - fully transparent funds and two types of semi-transparent products:
- Fully transparent - These funds fully disclose their holdings every day and publish an indicative value throughout the day based on their actual holdings. More than 98% of active AUM is invested in fully transparent funds.
- Proxy Portfolio - These funds do not disclose their full list of holdings. The funds create a proxy portfolio, that includes a subset of their holdings, as well as additional securities so that the proxy portfolio very closely tracks the actual valuation. There are several proxy portfolio models. Some base intraday values on the proxy portfolio, while others based them on the fund’s actual holdings.
- Authorized Participant Representative - The fund’s actual holdings are only disclosed on a quarterly basis, like mutual funds. There is a trusted agent who handles all creations and redemptions and handles the actual portfolio, which is not publicly available. Intraday values are based on the actual portfolio.
Chart 1: U.S. - Active ETP AUM by Asset Class2
In Part I of our 2023 ETP review we posited that high interest rates and the narrow list of U.S. equities that made gains through the first three quarters of 2023 resulted in relatively stronger than typical flows into fixed income funds compared to equity funds. The ability to select active managers who could overweight strongly performing stocks likely allowed actively managed equity ETPs to garner the lion’s share of 2023 flows relative to passive equity ETPs. By the end of 2023, 62% of active AUM was held in Equity funds, compared to 32% in fixed income, 3% in multi-asset and 2% in commodities. Nearly 76% of fund flows went to equities, with 24% going to fixed income. Commodity funds suffered outflows of $870mn.
Chart 2: 2023 Active ETP Fund Flows
ESG Funds3
After years of strong growth, Environmental, Social and Governance (ESG) focused funds lost favor in 2023. The combination of three quarters of stock market gains focused on a small group of stocks4, coupled with shifting sands in tracking and measuring ESG factors5, likely impacted this ETP category. The result was that ESG funds saw an outflow of $4.8 bn this year, ending with $118.6bn AUM. AUM increased 9.3% from 2022, on the back of overall positive markets.
| ESG Strategy | AUM Change | Flow ($ Billions) |
|---|---|---|
| Best-in-class | -12.8% | -$2.45 |
| ESG thematic strategy | -0.5% | -$1.54 |
| Exclusion screening | 29.6% | $0.87 |
| General integration | 13.5% | -$1.68 |
| Total | 9.3% | -$4.81 |
Cryptocurrency
Writing about 2023 Cryptocurrency ETP activity feels a bit “so yesterday” after the SEC X-account hack and next day approval of cash bitcoin ETPs, followed by the successful launch of ten products on January 11. We will give an overall update on the Crypto ETP world in the coming weeks. A brief preview: We do not believe that futures-based ETPs are going anywhere, but cash ETPs will likely trade more.
Cash bitcoin ETPs captured more than 20 times the AUM of the futures-based crypto products on their first day of trading on January 11, 2024. The Proshares Bitcoin Strategy (BITO, NYSE Arca-listed) ETP averaged ten million shares traded per day last year, holding more than 80% of the industry AUM, controlling $1.7bn of the $2.1bn industry-wide total at year-end. BITO also accounted for $568 million of the $798 million fund flows for the year. Since the launch of the cash bitcoin products, BITO volume has surged, possibly due to futures-cash arbitrage and as a hedge for market makers.
Average daily volume for the year was 12.7 million shares across all crypto ETPs but rose to more than 20 million in December as bitcoin rallied in anticipation of the SEC approving the cash products.
Chart 3: Futures-based Cryptocurrency ETP CADV6
Conclusion
We consider, with our always perfect 20/20 hindsight, the two biggest stories in ETPs in 2023 were the continued stellar growth in actively managed ETPs and the anticipation of cash bitcoin products. Certainly, for the early part of 2024, these two will continue to dominate the headlines in the industry.
ESG funds meanwhile appeared to lose favor. However, we think these funds remain an important category in the ETP pantheon and will likely continue to attract interest as companies and governments continue to focus on climate change and other ESG causes.
- Cryptocurrency, currency and volatility combined were 0.83% in 2021, 0.48% in 2022 and 0.67% in 2023
- All AUM and Flow Data Source Track Insight
- ESG Strategy definition source is Track Insight
- Approximately 90% of ESG AUM is in equity funds, with about 10% in fixed income and less than 1% in commodities.
- ICE offers detailed ESG and sustainability metrics. More information.
- Source: NYSE Research
Thursday, Jan. 11, 2024
Closing auction order impact
The NYSE Closing Auction remains the largest equity liquidity event, trading on average more than $18bn per day1. We have previously studied Closing Auction liquidity, participation, and price dislocation, and now focus on the price impact of auction order submission. We find that the market absorbs most large orders with little impact to the current stock price, especially on standard (i.e., non-rebalance) trading days.
We assess market impact of auction orders by examining the reference price and auction quantities from the auction imbalance data. Key data elements:
- Imbalance Reference Price: generally the NYSE last sale2
- Imbalance Quantity: the volume of better-priced buy (sell) shares that cannot be paired with both at-priced and better-priced sell (buy) shares at the Imbalance Reference Price3
- Paired Quantity: the volume of better-priced and at-priced buy shares that can be paired with better-priced and at-priced sell shares at the Imbalance Reference Price4
- Imbalance Change Ratio: the immediate imbalance volume change at the order entry over the rolling average of the total imbalance and paired quantities in previous 5 imbalance messages
Order Sizing and Price Impact
- This analysis focuses on the largest 2.5% of imbalance change ratios.
- These events represent on average 12% - 36% of the displayed total imbalance and paired quantity for stocks in the Russell 1000 index and 23% - 78% for other stocks.
- The 0.25% largest imbalance change ratios on standard days in Russell 1000 stocks represent roughly 36% of the published liquidity already in the auction.
- Order Sizing
- On rebalance days, auction orders for widely-held stocks such as those in the Russell 1000 have substantial liquidity early in the day, which means a large auction order entered in the last 5 minutes has less liquidity relative to existing auction liquidity.
- The opposite seems to hold for other stocks on rebalancing days, with large orders entered in the last 5 minutes representing a greater portion of the auction order liquidity relative to auction orders submitted earlier in the trading day.
3:55 - 4:00pm NYSE-listed Russell 1000 Stocks Imbalance Change Ratio
3:55 - 4:00PM All Other NYSE-listed Stocks Imbalance Change Ratio
- Price Impact per Order Size
- In most cases, observed price impact was well less than 1 times a stock’s daily average spread.
- As expected, the largest orders entered in the last 5 minutes had the most price impact.
- We consider ratio changes in the top 0.25% of all observations to be the largest orders.
- Interestingly, the more widely held Russell 1000 stocks were more impacted by the largest orders.
- On standard days, these stocks had a median 0.71X spread5 reference price move, compared to a 0.5X for other stocks.
- Rebalance days, when major indices such as the S&P, FTSE Russell, MSCI, and others adjust their portfolios, see more price impact from the largest changes.
- Russell 1000 stocks saw 1.77X spread moves, while other stocks saw 0.72X.
3:55 - 4:00pm NYSE-listed Russell 1000 Stocks Reference Price Change
3:55 - 4:00pm Other NYSE-listed Stocks Reference Price Change
- Price Impact over Time
- We further focus on the largest 0.25% imbalance change ratios over time in the last 5 minutes of the trading day.
- On standard days, price movement is fairly flat until the very last minute of the day.
- On rebalance days, these orders have increasing price impact throughout the period for Russell 1000 stocks; other stocks show decreasing price impact until the last 2 minutes.
3:55 - 4:00pm NYSE-listed Russell 1000 Stocks
3:55 - 4:00pm Other NYSE-listed Stocks
- Price Impact per Order Size over Time
- We investigate further on how the price impact looks given different order sizes over time in the last 5 minutes of the trading day.
- The largest orders have the most significant price impact for stocks in Russell 1000 index in the last 5 minutes on rebalancing days.
3:57 - 3:58pm Reference Price Changes
3:58 - 3:59pm Reference Price Changes
3:59 - 4:00pm Reference Price Changes
Conclusion
- On standard days, most large auction orders submitted in the last 5 minutes have less than 1X spread of impact on the market price.
- We see little difference in market impact between large orders and smaller orders.
- On these days price impact lessens or remains constant until the very last minute of the day.
- On rebalance days, prices seem more sensitive to increases in imbalance quantity.
- The largest orders in Russell 1000 stocks can have more significant price impact than orders in other stocks.
- Highlights
- The leverage in flexibility and size capacity on standard days could be further explored.
- Submitting orders early on rebalances and allowing offsetting interest to enter the market could have a less significant market impact.
Thursday, Jan. 11, 2024
2023: The Year in U.S. ETPs - Part 1
U.S.-listed Exchange Traded Products (ETPs) continued to grow in 2023, with total products rising to an all-time high of 3,368 from 3,074 at the end of 2022. Total AUM also grew from $6.5tn to $8.1tn. ETPs accounted for a smaller share of total U.S. equity market trading, falling to 30% of notional volume from 33% in 2022.
It has also been another strong year for NYSE Group’s ETP franchise. NYSE Group attained several milestones, reaching a record of more than 2,100 listed products. In addition, NYSE now boasts 13 ETPs trading on the NYSE floor, from just one at the end of 2022, with nine more listing since the start of 2024, including four transfers from other exchanges and more to come. Listing on the NYSE offers access to the exchange’s unique market model and liquidity providers, offering enhanced market quality as noted in our earlier post, along with access to the industry’s most knowledgeable team of advisers to assist new and existing issuers.
NYSE Group continues to dominate the ETP business, listing 75% of all Assets Under Management (AUM). NYSE Group funds accounted for 69% of new flow into ETPs in 2023 as well.
Over a series of pieces, we will review some of the major trends in ETPs in 2023, including active funds, cryptocurrency, and shifts in asset class AUM. Let’s look at the big picture landscape first.
Assets under management
Equities remain the largest asset class in the ETP universe, accounting for nearly 80% of AUM. Fixed Income funds stand a distant second at 18%. No other asset class even reaches 2%.
Chart 1: U.S. - Listed ETP AUM percentage by asset class
Note: All AUM and fund flow data source Track Insight. All other data source NYSE Research.
NYSE Arca and NYSE remain the dominant listing venue for ETPs, controlling 75% of AUM in U.S.-listed products, with 81% of equity ETPs, and more than 90% in commodity funds.
Chart 2: ETP AUM Share by listing venue and asset class
ETP fund flows
Despite U.S. equities finishing at/near record levels in 2023, much of the market’s gains were focused in a few large cap tech stocks. Gains were not broad based, with the equal-weighted S&P 500 gaining only 11.6% for the year, compared to 24.2% for the market-cap weighted index. The mid-cap S&P 400 and small-cap S&P 600 saw even weaker performance, rising 14.4% and 13.9% respectively. Through the first three quarters of the year, the S&P 600 was down 0.5% and the equal weight S&P 500 only eked out a 0.3% gain. This likely helps to explain why equity ETPs accounted for only 67% of fund flows, well below their nearly 80% share of market AUM. Fixed Income funds garnered 34% of the flows, while commodity funds witnessed net outflows as notably higher yields attracted investor interest, especially relative to the narrow gains in equities prior to the fourth quarter.
Chart 3: ETP Share of fund flows by asset class
Conclusion
2023 was another successful year for ETP growth. AUM in U.S.-listed funds increased by 25% to $8.1 trillion, with a net increase of 294 funds in 2023, resulting in 3,368 ETPs listed at the end of the year. In the upcoming weeks we will continue to dissect some major trends in the U.S. ETP market.
Monday, Dec. 04, 2023
Trends in options trading
Retail participation in options market trading rose sharply during the pandemic, peaking at 48% in July 2022. While it has bounced around since then, it hit 45% in July 2023 (Chart 1). This data suggests that substantial retail options trading is here for the foreseeable future.
Estimating the amount of retail trading in options trading requires a different methodology than used to estimate retail equities trading. We recently authored two articles discussing retail trading activity on the U.S. equity market: one on low-priced stocks and the other on market breadth.
Unlike equities1, all options trading is executed on exchange and reported to the Options Price Reporting Authority (OPRA) - the options equivalent of the equity markets’ Security Information Processers (SIPs). However, there are several mechanisms that allow market makers to offer price improvement and/or receive allocations on orders that are sent to them. These features allow us to estimate retail traders’ share of the U.S. options market.
We use a modified version of the methodology presented in a recent London Business School research paper.2 We combine trading in price improvement auctions, such as NYSE American’s CUBE, along with small trades executed electronically.3
Trades that meet any of the following conditions are counted as retail: fully electronic trades up to 10 contracts4, all executions in non-ISO/AON/complex price improvement auctions (regardless of trade size) and electronic trades greater than 10 contracts, if the total notional size of the trade was not greater than $5,000. We use the 10-contract limit because multiple options exchanges offer the ability for market makers to interact with order flow they provide up to five contracts, which may encourage trades close to that size to be executed electronically.5 While this methodology is not perfect – we are basing the volume from trades reported to the OPRA SIP - which could be part of larger “parent” orders – without direct knowledge of what trades are truly from retail customers, this methodology should provide a reasonable estimate.6
As Chart 1 below shows, retail’s share of options market trading rose sharply during the pandemic. In late 2019, retail options volume ranged between 34% and 38% of total trading7, peaking near 48% in the second half of 2020. It recently slipped to near 38% in October 2022, but has risen again, reaching 45% in July. The chart separately shows how much of total volume is from price improving auctions. Price improvement auctions have remained steady near 15% of total volume, while electronic trades8 by retail accounts notched larger gains.
Chart 1: Retail Share of Options Trading
Short-dated Options trends
The launch of exchange-traded U.S. equity options in 1973 offered only quarterly expiration dates in March, June, September, and December. Later, longer-term options (LEAPS) and monthly expiration dates were introduced. In recent years, weekly options series, and now even daily options expiries9 in SPY and QQQ, have been added.
The shortest to expiry options have increased sharply as a share of the U.S. options market. In November 2019, options with zero or one day to expiration were just over 12% of volume. As of the end of September, these options volume reached nearly 31%, with 22% in short-dated options10. This is due to activity on the final day of options trading for weekly, monthly, and quarterly series. Chart 2 below shows this trend. Short-dated options share rose from 6.4% in November 2019 to 21.6% through September 2023.
Chart 2: Share of Options Volume Trading by Time to Expiration
The rise in retail trading happened at the same time as the rise in short-dated options. This trend is even more pronounced for trading we determine to be retail (Chart 3). Specifically, 56% of all retail options volume is now in options with five or fewer days to expiry, compared to about 35% in November 2019. Short-dated options share more than tripled to 26.3% from 7.8% over the same period.
Chart 3: Share of Retail Options Trading by Time to Expiration
It is also instructive to understand the retail share of options trading activity by days to expiry as shown in Chart 4. As we previously noted, currently, overall retail share of the options market is around 45%. However, retail is far more prevalent in shorter dated options than in options with greater time to expirations. For example, we estimate retail accounts for 34% of options trading of options with roughly 1-3 months to expiration, and about 31% for options with more than three months to expiration. Short-dated options are currently 51% retail. This number dipped to 41% at the onset of the heavy pandemic trading in March 2020, before trading approaching current levels from late 2020 until early 2022. It began to slip through 2022 before returning to pandemic-era levels, as options volume concentration has continued to rise in SPY and QQQ, which are heavily concentrated in short-dated options activity (see next sections).
Chart 4: Retail Share of Trading by Time to Expiration
Low-price Options Trends
One point that has often been mentioned is that retail traders are more likely to buy low priced options than institutions. We categorize low-priced options as any options contract traded at a price of $0.25 or less. While traders do not necessarily expect these options to ever finish in-the-money, their activity implies an expectation of a quick move in the direction of their trade, which can result in very large price changes. While the overall increase in short-dated options trading is likely to cause increased volume in low-priced options, we still find a substantial difference in the share of retail volume in such contracts, compared to non-retail volume. Recently, 28% of retail volume has been in low-priced options. This compares to 25% across all accounts (Chart 5).
Symbol Concentration
Much like notionally-weighted trading in the U.S. equity market, which has been dominated by passive trading via a few very large ETFs11 and a small group of mega-cap stocks, concentration in options trading volume has increased sharply in recent years. As Chart 7 below shows, more than half of all options contract volume is now in the ten largest symbols. Prior to the pandemic, retail trading was noticeably less heavily weighted to the top 10 securities, but over the last two years, the retail and overall trend have largely merged.
Top 10 non-ETP Symbols by Volume 2023: Q3
| Rank | Overall | Retail |
|---|---|---|
| 1 | TSLA | TSLA |
| 2 | NVDA | NVDA |
| 3 | AAPL | AAPL |
| 4 | AMZN | AMD |
| 5 | AMD | AMZN |
| 6 | AMC | META |
| 7 | META | MSFT |
| 8 | MSFT | PLTR |
| 9 | PLTR | AMC |
| 10 | BABA | NIO* |
Chart 5: Share of Volume in Low-price Options - Overall vs. Retail Accounts
Chart 6 below shows the increased concentration of single-name symbol volume. Concentration has grown steadily since 2019, with even greater concentration by retail accounts. More than 40% of single-name retail options volume is in the top 10 symbols compared 26% in November 2019. Overall growth is a bit less, rising to 37% from 23% during the same time.
Chart 6: Share of Volume in Low-price Options - Overall vs. Retail Accounts
Conclusion
Most estimates of retail trading in the U.S. stock market centers around 50% of total market volume. Using our estimate, retail share of U.S. equity markets options volume is slightly lower at 45%, although differing measurement techniques may account for the small disparity. The increase in retail options share was initially fueled by the pandemic in 2020 and has continued to grow as retail options traders have latched on to short-dated options to make bets on market direction. There has also been an increasing share of volume in low-priced options, further fueling overall options volumes, and especially retail trading. None of these trends appear to be in danger of reversing.
The continued increased concentration of trading in a few large ETFs has also reared its head in the options market. While we do not see this as a necessarily permanent shift, until investors broaden their focus to smaller cap issues, which have less coverage in the options market, this trend is not likely to reverse any time soon.
1 Most US equity retail activity is routed to “wholesale” market makers, executed off-exchange and reported to one of the FINRA Trade Reporting Facilities (TRFs).
2 Retail Trading in Options and the Rise of the Big Three Wholesalers, forthcoming Journal of Finance
3 We exclude complex multi-leg trades, trades executed on the various options trading floors, other auctions, and non-standard order types such as Intermarket Sweep Orders (ISOs), which retail accounts typically cannot access.
4 We make use of proprietary data to identify executions that are tagged as customer trades.
5 We look for trades that have a customer on one or both sides of the trade. We divide this measure by total options volume. This is like how retail activity is estimated in U.S. equities. However, in U.S. equities, retail orders rarely execute against other retail orders. There is greater opportunity for retail orders to trade with other retail orders in the options market because all orders execute on exchange. We can calculate a related retail value, which would measure all sides - buys and sells. This roughly halves the retail share we used for the article. We chose the single counted statistic because it is in more common usage.
6 The paper noted above (Retail Trading in Options and the Rise of the Big Three Wholesalers) attempts to eliminate the parent order issue by looking for trades executed on the same exchange at virtually the same moment to eliminate larger orders. While this may help, it may over filter, as there also may be many small trades broken up by algorithms that get captured in the five-contract limit. OPRA data does not indicate customer-type (Customer/Firm/Market Maker), which could help with this kind of filtering.
7 When we calculate share of volume, we consider both the buy and sell side (or equivalently, the liquidity providing and liquidity taking side). If reported volume is 100 contracts, then there were 200 contracts traded - 100 bought and 100 sold. Our estimates count one side of the simple price improvement auctions as retail and estimates both sides of OPRA auto trades.
8 Electronic trades are the difference between the total line (blue) and the price improvement auction line (black).
9 SPY and QQQ options series have expiries for each day of the week and are initially issued as options with two weeks to expiration. IWM has expiries on Monday, Wednesday and Friday, initially issued with a two-week life. USO, UNG, GLD, SLV and TLT have two-week options that expire on Wednesday and Friday.
10 Options expiring on the same day.
11 The top two options trading symbols are ETFs: SPY and QQQ. Their retail options volume was greater than the next nine options in September 2023, and the next 12 for all options trading.
Tuesday, Oct. 17, 2023
Closing Auction: Immediate market impact, price drift and transaction cost of trading Part 2
Transaction cost analysis
A standard Transaction Cost Analysis (TCA) usually defines trading cost as a function of the slippage against a conventional benchmark, reflecting the impact of volatility, spread, participation rate, order size and daily volume among other factors. In this analysis, we review multiple TCA extensions tailored to the unique trading profile of the final minutes of trading on the NYSE leading into the NYSE Closing Auction. Specifically, we:
- Estimate the potential dollar-cost or dollar-savings of orders intended for the NYSE Closing Auction, and
- Examine how the relationship between the order side and auction imbalance side impacts these metrics.
Definitions
Auction orders are orders eligible for execution in the NYSE Closing Auction and are included in the imbalance calculation. These include Market-on-Close and Limit-on-Close orders, Closing Imbalance Offset orders and D-Orders.
The marketability of an auction order is determined by the limit price of that order compared to the continuous book clearing price and imbalance side of the most recent imbalance update message.
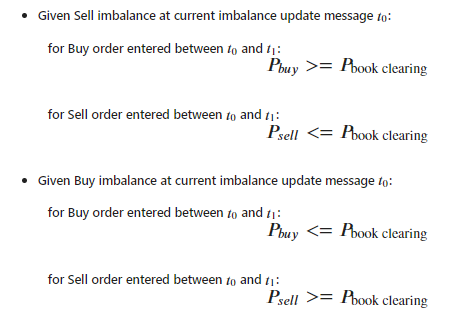
Offsetting orders are marketable auction orders entered on the opposite side of an imbalance to offset it, while joining orders are marketable auction orders entered on the same side of an imbalance.
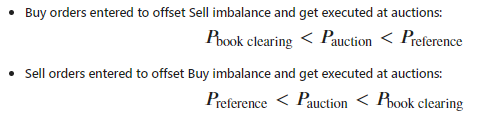
Auction order executed volume offsetting vs joining the imbalances
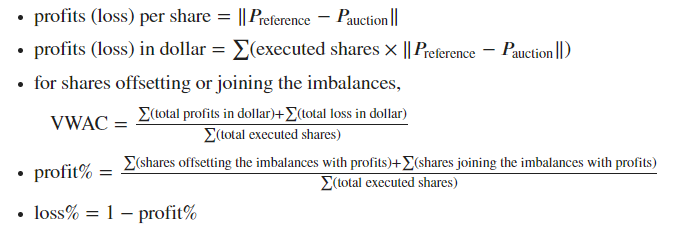
VWAC is the Volume Weighted Average Cost in dollars of an auction order at each minute and is considered separately for offsetting and joining order flow. VWAC is similar to the more commonly used Volume Weighted Average Price (VWAP), but emphasizes the net cost benchmarked to the market rather than simply the stock price itself. Positive VWAC values reflect a gain, while negative VWAC values reflect a loss. Our measure of an order’s profitability discussed below considers the order’s execution price at the NYSE Closing Auction relative to the reference price at the time of order entry. For example, when a buy order is entered and eventually executes in the NYSE Closing Auction at a price lower than the order entry reference price, this price difference is considered a proxy for the cost saved by executing at the NYSE Closing Auction.
Statistics
Offsetting auction orders have a VWAC range of +$0.0075 to +$0.014 for corporate stocks in the S&P 400, S&P 500 and S&P 600. The VWAC tends to be slightly higher for stocks in the S&P 500, peaking at $0.03 at around 3:58pm, but lower for ones in the S&P 600, with the first 3 minutes of the imbalance period having a negative dollar cost.
In contrast, joining auction orders for the entirety of the S&P 1500 universe have a negative VWAC (i.e., a loss), and the average cost per minute ranges from -$0.03 to +$0.01, with some gain observed in the first 3 minutes of the imbalance period for S&P 600 names. We calculated the average order size relative to each stock’s CADV to track how the net cost per minute changes as order size changes. Although stocks within the S&P 500 had smaller average order size compared to the other two groups, offsetting orders continued to show higher VWAC (gain).
The divergence in VWAC between imbalance-offsetting and imbalance-joining orders highlights the increasing benefits in offsetting posted imbalances when trading into the close, with benefits observed for both larger and relatively smaller order sizes.
$VWAC and %Order Size for S&P400, S&P500, S&P600
Profitable auction order offsetting vs joining the imbalances in %
Summary
- Closing auction orders as large as 2.5% of CADV for Russell 1000 stocks result in an immediate price move of around 0.3X the daily average spread, and the stocks not in the Russell 1000 have a less immediate price move, suggesting the market takes more time to digest and react to information in auctions of less-active stocks.
- Across all stocks, impact is likely to increase when order entry gets very close to the end of trading.
- During the imbalance period between 15:57 - 16:00, auction orders could be sized up to approximately 0.47%, 0.86% and 1.18% of CADV before triggering the large and persistent market impact.
Part 2:
- Imbalance-offsetting auction orders have a VWAC range of +$0.0075 to +$0.014 for corporate stocks in the S&P 1500, while imbalance-joining auction orders are more likely to have negative VWACs.
- The divergence in VWAC between imbalance-offsetting and imbalance-joining auction orders highlights the increasing benefits of offsetting posted imbalances when trading into the close.
- Imbalance-offsetting auction orders show a higher probability of being executed at a better price and attaining some degree of cost savings than imbalance-joining orders.
Wednesday, Oct. 11, 2023
The shifting dynamics of the NYSE Closing Auction: An inside view
The NYSE Closing Auction has traditionally been - and remains - the largest liquidity event of the US trading day. Through the first three quarters of 2023, the NYSE Closing Auction typically sees an average of 300 million shares ($17.8bn) trading on a normal day, and close to 2.5 billion shares ($116bn) on options/futures expiration and index rebalance days. Investors can employ a variety of order types to participate in the closing auction, providing flexibility in managing risk and market impact. In this post, we dive into the NYSE Closing Auction and provide an inside view into closing auction order entry time dynamics and performance.
D-Orders gain momentum
Closing D-OrdersTM - submitted exclusively through NYSE floor brokers - provide additional flexibility over Market on Close (MOCs) or Limit on Close (LOCs) orders as floor brokers can interact with liquidity on either side of an imbalance on behalf of their clients, with additional time for order entry and modification. In Q3 2023, D-Orders overtook MOCs as the top order type in terms of executed volume in the NYSE Closing Auction for the first time since their introduction. In Q3 2023, D-Orders accounted for 42.7% of executed volume, up from 34.5% at the start of 2021. This marked the third successive quarter of increasing D-Order share with MOCs giving up almost the entirety of that share gain.
Figure 1
NYSE Closing Auction Order Type Composition (2021-2023 YTD)
Last 5 minutes still lead
One of the distinct features of D-Orders is the ability for floor brokers to submit D-Orders up until 3:59:50PM, compared to the 3:50:00PM cutoff for MOCs and LOCs. As Figure 2 below shows, over 90% of all D-Orders are submitted after 3:30PM, and over 2/3 are submitted within four minutes and fifty seconds of the cutoff time.
At the end of 2022 the NYSE introduced new flexible connectivity options for Floor Brokers, allowing firms to design their own proprietary order management systems for their clients or use a new standardized solution. As of October 2023, over 40% of all D-Orders executed in the NYSE Closing Auction are submitted by floor brokers using these new connectivity options. Throughout this transition, the order entry dynamics shown below remain steadfast.
Figure 2
D-Order Order Entry Time Breakdown
While this order entry time trend has remained largely steady, there is meaningful variance on special days such as index rebalances. As Figure 3 shows, on special event days the distribution of submitted D-Orders skews towards the earlier part of the trading day and, despite the last five or so minutes still seeing most of the order flow, pre-3:30PM D-Orders account for double their normal share on the largest such events (e.g., Russell Reconstitution, quarterly rebalances).
Figure 3
D-Order Order Entry Time Breakdown by Type of Day
(2022-2023 YTD)
NYSE Closing Auction performance continues to improve
One way to evaluate the impact of these order entry trends is to examine the slippage between the official NYSE Closing Price and the Volume-Weighted Average Price (VWAP) of preceding time intervals leading into the start of NYSE Closing Auction. Figure 4 below shows a time series of the median slippage between the NYSE Closing Price and the preceding 3-minute VWAP broken down into four distinct time groups. The slippage, or deviation, between the official closing price and NYSE VWAP during those time groups between 3:57PM and 4:00PM has been steadily narrowing since the start of 2023. This suggests improved price discovery in the Closing Auction as liquidity has increased and access methods have expanded.
Figure 4
NYSE Median Close Slippage vs Preceding NYSE VWAP
(corporate stocks only)
Finally, we examine market volatility in the last ten seconds of trading (3:59:50-4:00:00). Figure 5a shows a timeseries of the notional-weighted coefficient of variation1 during the last ten seconds of trading for Tape A and Tape C corporate stocks broken down by dollar-notional group, while Figure 5b shows the notional-weighted price range2 of each corporate stock’s price movement during the same interval. Both charts show that 1) NYSE-listed corporate stocks - especially those in the lower dollar-notional groups - experience less end-of-day volatility, and 2) thus far this volatility advantage has remained stable during the ongoing Floor Broker technology migration.
Figure 5a
15:59:50-16:00:00
Notional-weighted Coefficient of Variation1
(corporate stocks only, broken down by monthly average dollar-notional stock group)
Conclusion
- The NYSE Closing Auction remains the largest liquidity event of the US trading day and D-Orders are becoming the most popular order type used to participate in it.
- Most D-Orders are submitted in the last thirty minutes of trading, yet investors need to be aware of the impact that special days, such as expirations and rebalances, have on these order entry time dynamics.
- As the floor broker technology continues to evolve in new and innovative ways, NYSE-listed corporate stocks continue to enjoy superior price discovery mechanics and outstanding market quality in the NYSE Closing Auction.