
Review of Q1: New normal?
Published
April 18, 2024
In what is becoming tradition, the New York Stock Exchange made five more bold predictions for the active ETF market in 2024:
- Assets under Management (AUM): Grow from $530 billion to exceed $750 billion by year-end 2024
- Full-year cash flow: A new highwater mark of over $150 billion
- Launch activity: 400 new active ETFs from over 100 issuers
- Growth milestone: One quarter of over $50 billion in cash flow and one issuer with over $40 billion for the year
- Regulatory: Either active, semi-transparent will see expansion to another asset class or multi-share class will receive approval by the SEC
So how did we do through quarter one?
- Assets have grown to nearly $620 billion. Give us three more quarters of comparable growth and we will have hit the mark.
- Quarter one cash flow totaled $64.7 billion. A number that far exceeded our expectations and paces that our prediction of $150 billion look achievable.
- The industry welcomed 109 ETFs from 49 different issuers, with combined assets at the end of the quarter of $6.9 billion. We are on pace for these predications to become reality.
- One of our two growth milestones is already a lock through quarter one with the other off to a strong start. Cash flow of $64.7 billion exceeded our lofty $50 billion goal and smashed the prior record of $46.8 billion achieved in quarter four of 2023. Growth milestone two of an issuer with over $40 billion in cash flow started the year on pace as Dimensional ended the quarter with $10.3 billion in cash flow.
- Our regulatory predications remain in limbo. Notably, four additional firms (First Trust, Guinness Atkinson, Morgan Stanley and TCW) filed for exemptive relief to offer multi-share class funds during the quarter. These firms join prior filers Dimensional, Fidelity, F/m Investments and Perpetual in seeking exemptive relief from the SEC.
Beyond our bold predictions, there are three additional stats from the quarter that stood out to us:
- Active ETF cash flow as a percentage of total ETF industry cash flow: 28%, down from the high of 33% experienced in Q1 of 2023 yet the second highest on record
- Firms with postive cash flow: 193 firms, or nearly 70% of firms; on pace for the average over the last year
- ETFs with postive cash flow: 878 active ETFs, or nearly 65% of all ETFs; up sizably from Q4 2023’s 50%
Before diving into the specifics of the quarter, we wanted to contextualize the growth of the active ETF with a few graphs.
Active Mutual Fund vs ETF AUM
Source: Factset as of 3/31/2024
Annual Active Mutual Fund vs ETF Cash Flow (Post ETF Rule)
Source: Factset as of 3/31/2024
Cumulative Active Mutual Fund vs. ETF Cash Flow (Post ETF Rule)
Source: Factset as of 3/31/2024
These graphs both demonstrate the undercurrent that is fueling the recent growth of the active ETF market and also show the longer term opportunities that exist.
Quarterly Active ETF Cash Flows
Source: Factset as of 3/31/2024
Annual Active ETF Cash Flows
Source: Factset as of 3/31/2024
| Global Equity | Domestic Equity | Domestic Fixed Income | Global Fixed Income | Commodities | Asset Allocation | Alternatives | Currency | |
|---|---|---|---|---|---|---|---|---|
| AUM Leader | Dimensional | Dimensional | JPMorgan | First Trust | Invesco | WisdomTree | First Trust | ProShares |
| AUM Leader $B | $41.4 | $82.0 | $28.5 | $24.6 | $5.1 | $1.4 | $1.5 | $2.9 |
| Q1 CF Leader | Dimensional | iShares | Alpha Architect | Janus | Invesco | Capital Group | Simplify | ProShares |
| Q1 CF Leader $B | $3.6 | $6.8 | $1.4 | $2.4 | $0.05 | $0.2 | $0.4 | $0.45 |
Source: Factset as of 3/31/2024
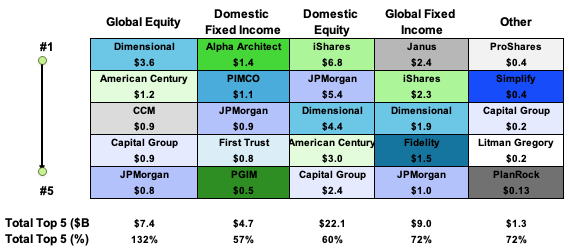
At the issuer level, Dimensional and JP Morgan again positioned themselves to be among the cash flow leaders in 2024, taking in $10.3 billion and $8.1 billion, respectively. Sandwiched between them at #2 for the quarter was BlackRock/iShares with $8.5 billion. Their flows were carried by $6.9 billion into the BlackRock U.S. Equity Factor Rotation ETF and $2.3 billion into the BlackRock Flexible Income ETF. Dimensional maintained its consistency through the quarter as all 38 ETFs maintained positive cash flow yet again. JP Morgan led all issuers with three ETFs in the top 10 in cash flow: JEPQ (+$2.9 billion), JEPI (+$1.7 billion) and JGLO (+$1.2 billion). Capital Group (+$4.7 billion), American Century/Avantis (+$4.5 billion), First Trust/Vest (+$3.6 billion), Janus ($+2.8 billion), Fidelity (+$2.3 billion), PIMCO (+$1.6 billion), GraniteShares (+$1.5 billion), Alpha Architect (+$1.5 billion), YieldMax (+$1.1 billion), AB (+$1.1 billion) and SEI (+$1.1 billion) rounded out the list of issuers with greater than $1 billion in cash flows for their actively managed lineups. Notably, the number of firms with $1 billion in cash flow during Q1 doubled year over year. American Century/Avantis and Capital Group both saw flows across their lineups into their broader market, lower cost actively managed ETFs. First Trust/Vest saw flows across their core fixed income ETFs along with a range of their defined outcome strategies. Fidelity, PIMCO and Alpha Architect were all led by strong flows into a singular fixed income ETF; Fidelity Total Bond ETF (FBND, +$1.4 billion,), PIMCO Enhanced Short Maturity ETF (MINT, +$0.9 billion), Alpha Architect 1-3 Month Box ETF (BOXX, +$1.4 billion). GraniteShares and YieldMax both benefited from their differing single stock focused lineups. GraniteShares was led by $1.0 billion into its 2x Long NVDA Daily ETF (NVDL) and YieldMax by the trio of Option Income focused ETFs off Tesla (+$0.2 billion, TSLY), Nvidia (+$0.2 billion, NVDY) and Coinbase ($+0.2 billion, CONY). AB saw growth across their lineup, yet it was most concentrated in their Conservative Buffer ETF (BUFC, +$0.5 billion) and Ultra Short Income ETF (+$0.3 billion, TAFI). Lastly, SEI experienced fairly balanced growth across its lineup of Factor focused ETFs.
Q1 2024 Cash Flow Leaders by Asset Class
Source: Factset as of 3/31/2024
During Q1, nearly 70% of issuers experienced positive cash flows and nearly a fourth had cash flows in excess of $50 million. In addition to the issuers mentioned above, CCM (+$0.9 billion), RexShares (+$0.8 billion), Simplify (+$0.8 billion), T. Rowe Price (+$0.8 billion), Neos (+$0.7 billion), PGIM (+$0.6 billion), Morgan Stanley (+$0.6 billion) and ALPS (+$0.5 billion) all crossed $0.5 billion in net cash flows. These eight issuers found varied paths to their success, from ultra-short, fixed income (PGIM), equity income (Neos), broad equity (T.Rowe & CCM), floating rate (Morgan Stanley), core fixed income (ALPS), single ETF/stock inverse (RexShares) and a variety of strategies (Simplify).
| Ticker | Top 10 ETFs by Cash Flow | Q1 2024 ($M) |
|---|---|---|
| DYNF | BlackRock U.S. Equity Factor Rotation ETF | $6,919 |
| JEPQ | J.P. Morgan Nasdaq Equity Premium Income ETF | $2,881 |
| JAAA | Janus Detroit Street Trust Janus Henderson AAA CLO ETF | $2,331 |
| BINC | BlackRock Flexible Income ETF | $2,254 |
| JEPI | JPMorgan Equity Premium Income ETF | $1,725 |
| AVUV | Avantis U.S. Small Cap Value ETF | $1,481 |
| FBND | Fidelity Total Bond ETF | $1,435 |
| BOXX | Alpha Architect 1-3 Month Box ETF | $1,406 |
| JGLO | JPMorgan Global Select Equity ETF | $1,173 |
| CGDV | Capital Group Dividend Value ETF | $1,058 |
Source: Factset as of 3/31/2024
| Ticker | Bottom 10 ETFs by Cash Flow | Q1 2024 ($M) |
|---|---|---|
| ARKK | ARK Innovation ETF | $(1,312) |
| FTSM | First Trust Enhanced Short Maturity ETF | $(651) |
| JIRE | JPMorgan International Research Enhanced Equity ETF | $(543) |
| ICSH | BlackRock Ultra Short-Term Bond ETF | $(520) |
| BLOK | Amplify Transformational Data Sharing ETF | $(509) |
| TOTL | SPDR DoubleLine Total Return Tactical ETF | $(420) |
| PJUL | Innovator U.S. Equity Power Buffer ETF - July | $(342) |
| TUA | Simplify Short Term Treasury Futures Strategy ETF | $(307) |
| ARKG | ARK Genomic Revolution ETF | $(274) |
| FLCO | Franklin Investment Grade Corporate ETF | $(273) |
Source: Factset as of 12/31/2023
At the product level, nearly 65% of active ETFs saw positive flows for the quarter and 239 experienced flows over $50 million (often viewed as a general break-even measure for an ETF), double the total at the same time last year. The industry’s asset weighted expense ratio stayed steady at 0.42% through the quarter. Nearly 75% of all cash flows went into ETFs with expense ratios below the industry average. Year-over-year cash flow increased into ETFs with expense ratios above the industry average largely as a result of increased use of structured product ETFs that either seek downside protection or provide access to single stock/ETFs focused on income or leverage. Only 13 of the 109 ETFs launched during the quarter offered an expense ratio equal to or below the industry average.
| Expense Ratio | 3/31/24 AUM | Q1 2024 CF | % AUM | % CF | # ETFs |
|---|---|---|---|---|---|
| 0-25 | $217,134,455,190 | $18,047,262,458 | 35% | 28% | 145 |
| 26-50 | $216,950,641,407 | $32,418,905,302 | 35% | 50% | 309 |
| 51-75 | $86,059,938,377 | $6,357,923,606 | 14% | 10% | 358 |
| 76+ | $99,371,448,643 | $7,884,136,465 | 16% | 12% | 582 |
| Expense Ratio | 3/31/23 AUMM | Q1 2023 CF | % AUM | % CF | # ETFs |
|---|---|---|---|---|---|
| 0-25 | $139,893,428,880 | $9,427,297,353 | 36% | 34% | 103 |
| 26-50 | $116,550,206,419 | $13,644,604,352 | 30% | 50% | 206 |
| 51-75 | $63,557,058,230 | $2,483,242,706 | 17% | 9% | 253 |
| 76+ | $65,038,778,966 | $1,940,102,087 | 17% | 7% | 382 |
Source: Factset as of 3/31/2024
Q1 2024 Launch Monitor
Domestic Equity
57 ETFs Launched
$1.7 B Assets Raised
Domestic Fixed Income
114 ETFs Launched
$740 M Assets Raised
Asset Allocation
6 ETFs Launched
$88 M Assets Raised
Int'l/Global Equity
24 ETFs Launched
$3.1 B Assets Raised
Int'l/Global Fixed Income
6 ETFs Launched
$700 M Assets Raised
Other
5 ETFs Launched
$679 M Assets Raised
Source: FactSet as of 3/31/2024, figures include MF-ETF conversions; Other includes Alternative, Commodities & Currencies
In the first quarter of 2024, 109 actively managed ETFs launched, raising $6.9 billion in assets. Launches came from 49 different issuers, including 14 first-time issuers. ETF development continued to focus on equities with nearly 75% of new ETFs focused on the asset class. During the quarter, Innovator launched the most ETFs (13) and Eagle Capital raised the most assets (+$1.8 billion via conversion).
Q1 2024 ETF Launches
| Ticket | Name | Issuer | Launch Date | Asset Class | AUM |
|---|---|---|---|---|---|
| JANP | PGIM US Large-Cap Buffer 12 ETF - January | PGIM | 1/2/24 | Equity | $3,159,192 |
| PBJA | PGIM US Large-Cap Buffer 20 ETF - January | PGIM | 1/2/24 | Equity | $2,595,866 |
| AJAN | Innovator Equity Defined Protection ETF - 2 Yr to January 2026 | Innovator | 1/2/24 | Equity | $78,771,750 |
| HJAN | Innovator Premium Income 9 Buffer ETF - January | Innovator | 1/2/24 | Equity | $8,631,140 |
| JAND | Innovator Premium Income 10 Barrier ETF - January | Innovator | 1/2/24 | Equity | $4,975,000 |
| JANH | Innovator Premium Income 20 Barrier ETF - January | Innovator | 1/2/24 | Equity | $9,288,750 |
| JANJ | Innovator Premium Income 30 Barrier ETF - January | Innovator | 1/2/24 | Equity | $24,063,000 |
| JANQ | Innovator Premium Income 40 Barrier ETF - January | Innovator | 1/2/24 | Equity | $14,145,000 |
| LJAN | Innovator Premium Income 15 Buffer ETF - January | Innovator | 1/2/24 | Equity | $15,986,750 |
| MYLD | Cambria Micro and SmallCap Shareholder Yield ETF | Cambria | 1/4/24 | Equity | $27,593,370 |
| TYLD | CambriaTactical Yield ETF | Cambria | 1/4/24 | Fixed Income | $11,340,000 |
| FTRB | Federated Hermes Total Return Bond ETF | FederatedHermes | 1/4/24 | Fixed Income | $66,303,299 |
| HYKE | Vest 2 Year Interest Rate Hedge ETF | Cboe Vest | 1/11/24 | Alternatives | $ 718,130 |
| AAPX | T-Rex 2X Long Apple Daily Target ETF | T-Rex | 1/11/24 | Equity | $3,602,106 |
| GOOX | T-Rex 2X Long Alphabet Daily Target ETF | T-Rex | 1/11/24 | Equity | $5,450,000 |
| MSFX | T-Rex 2X Long Microsoft Daily Target ETF | T-Rex | 1/11/24 | Equity | $6,287,400 |
| DYFI | IDX Dynamic Fixed Income ETF | IDX | 1/10/24 | Fixed Income | $26,137,692 |
| MEMS | Matthews Emerging Markets Discovery Active ETF | MatthewsAsia | 1/11/24 | Equity | $6,271,200 |
| MCHS | Matthews China Discovery Active ETF | MatthewsAsia | 1/11/24 | Equity | $2,084,848 |
| LGHT | Langar Global HealthTech ETF | LangarInvestment Management | 1/10/24 | Equity | $1,880,478 |
| YBTC | Roundhill Bitcoin Covered Call Strategy ETF | Roundhill | 1/18/24 | Currency | $15,245,552 |
| TBFG | Brinsmere Fund Growth ETF | The BrinsmereFunds | 1/16/24 | Asset Allocation | $274,497,500 |
| TBFC | Brinsmere Fund Conservative ETF | The BrinsmereFunds | 1/16/24 | Asset Allocation | $280,336,388 |
| YMAX | YieldMax Universe Fund of Option Income ETFs | YieldMax | 1/17/24 | Equity | $81,625,500 |
| RJMG | FT Raymond James Multicap Growth Equity ETF | First Trust | 1/18/24 | Equity | $7,614,084 |
| CCMG | CCM Global Equity ETF | CCM | 1/18/24 | Equity | $968,798,040 |
| MNTL | Tema Neuroscience and Mental Health ETF | Tema | 1/23/24 | Equity | $11,177,716 |
| TRES | Defiance Treasury Alternative Yield ETF | Defiance ETFs | 1/25/24 | Alternatives | $3,040,625 |
| XJAN | FT Vest U.S. Equity Enhance & Moderate Buffer ETF - January | FT Cboe Vest | 1/22/24 | Equity | $87,096,688 |
| INAV | Mohr Industry Nav ETF | Mohr Funds | 1/25/24 | Equity | $14,113,170 |
| QFLR | Innovator Nasdaq-100 Managed Floor ETF | Innovator | 1/25/24 | Equity | $84,565,000 |
| CCEF | Calamos CEF Income & Arbitrage ETF | Calamos | 1/16/24 | Asset Allocation | $7,172,879 |
| FEBP | PGIM US Large-Cap Buffer 12 ETF - February | PGIM | 2/1/24 | Equity | $3,645,666 |
| PBFB | PGIM US Large-Cap Buffer 20 ETF - February | PGIM | 2/1/24 | Equity | $3,611,338 |
| QQQI | NEOS Nasdaq 100 High Income ETF | NEOS | 1/30/24 | Equity | $76,587,200 |
| IFEB | Innovator International Developed Power Buffer ETF February | Innovator | 2/1/24 | Equity | $13,560,750 |
| FLJJ | AllianzIM U.S. Equity 6 Month Floor5 Jan/Jul ETF | AllianzInvestment Management | 2/1/24 | Equity | $11,075,458 |
| SIXF | AllianzIM U.S. Large Cap 6 Month Buffer10 Feb/Aug ETF | AllianzInvestment Management | 2/1/24 | Equity | $18,784,678 |
| DCMT | DoubleLine Commodity Strategy ETF | DoubleLine | 2/1/24 | Commodities | $22,453,227 |
| MVPA | Miller Value Partners Appreciation ETF | Miller Value | 1/31/24 | Equity | $53,109,000 |
| YMAG | YieldMax Magnificent 7 Fund of Option Income ETFs | YieldMax | 1/30/24 | Equity | $31,720,440 |
| NBOS | Neuberger Berman Option Strategy ETF | NeubergerBerman | 1/29/24 | Equity | $462,582,365 |
| KPRO | KraneShares 100% KWEB Defined Outcome January 2026 ETF | KraneShares | 2/7/24 | Equity | $2,536,524 |
| KBUF | KraneShares 90% KWEB Defined Outcome January 2026 ETF | KraneShares | 2/7/24 | Equity | $2,576,014 |
| EVLN | Eaton Vance Floating-Rate ETF | MorganStanley | 2/7/24 | Fixed Income | $567,336,000 |
| MGNR | AmericanBeacon GLG Natural Resources ETF | AmericanBeacon | 2/6/24 | Equity | $32,926,529 |
| CANQ | CalamosAlternative Nasdaq & Bond ETF | Calamos | 2/13/24 | Asset Allocation | $1,251,390 |
| SFEB | FT Vest U.S.Small Cap Moderate Buffer ETF - February | First Trust | 2/20/24 | Equity | $56,098,040 |
| XFEB | FT Vest U.S.Equity Enhance & Moderate Buffer ETF - February | First Trust | 2/20/24 | Equity | $34,243,823 |
| KNOW | FundamentalsFirst ETF | Mason Capital | 2/22/24 | Asset Allocation | $1,575,000 |
| AOHY | Angel OakHigh Yield Opportunities ETF | Angel Oak | 2/20/24 | Fixed Income | $76,791,216 |
| MBS | Angel OakMortgage-Backed Securities ETF | Angel Oak | 2/20/24 | Fixed Income | $32,221,536 |
| MSTY | YieldMax MSTROption Income Strategy ETF | YieldMax | 2/22/24 | Equity | $72,866,250 |
| FFLV | FidelityFundamental Large Cap Value ETF | Fidelity | 2/26/24 | Equity | $1,051,590 |
| SCLZ | Swan EnhancedDividend Income ETF | Swan Global | 2/27/24 | Equity | $2,510,635 |
| MRCP | PGIM USLarge-Cap Buffer 12 ETF - March | PGIM | 3/1/24 | Equity | $3,553,337 |
| PBMR | PGIM USLarge-Cap Buffer 20 ETF - March | PGIM | 3/1/24 | Equity | $4,549,363 |
| FLDB | Fidelity LowDuration Bond ETF | Fidelity | 2/26/24 | Fixed Income | $5,010,500 |
| NRES | XtrackersRREEF Global Natural Resources ETF | DWS | 2/27/24 | Equity | $11,929,778 |
| MAGX | RoundhillDaily 2X Long Magnificent Seven ETF | Roundhill | 2/29/24 | Equity | $2,136,000 |
| MAGQ | RoundhillDaily Inverse Magnificent Seven ETF | Roundhill | 2/29/24 | Equity | $ 481,864 |
| GINX | SGI EnhancedGlobal Income ETF | Summit Global | 2/29/24 | Equity | $50,687,312 |
| USDX | SGI EnhancedCore ETF | Summit Global | 2/29/24 | Equity | $48,897,300 |
| ULTY | YieldMaxUltra Option Income Strategy ETF | YieldMax | 2/29/24 | Equity | $39,936,525 |
| CAAA | First TrustCommercial Mortgage Opportunities ETF | First Trust | 2/28/24 | Fixed Income | $15,142,540 |
| SCIO | First TrustStructured Credit Income Opportunities ETF | First Trust | 2/28/24 | Fixed Income | $15,210,416 |
| MVPL | Miller ValuePartners Leverage ETF | Miller Value | 2/28/24 | Equity | $5,511,807 |
| MBSF | ReganFloating Rate MBS ETF | Regan Capital | 2/28/24 | Fixed Income | $37,867,500 |
| SIXP | AllianzIMU.S. Large Cap 6 Month Buffer10 Mar/Sep ETF | AllianzInvestment Management | 3/1/24 | Equity | $24,096,560 |
| IMAR | InnovatorInternational Developed Power Buffer ETF March | Innovator | 3/1/24 | Equity | $12,115,825 |
| QDTE | RoundhillN-100 0DTE Covered Call Strategy ETF | Roundhill | 3/7/24 | Equity | $8,127,288 |
| XDTE | RoundhillS&P 500 0DTE Covered Call Strategy ETF | Roundhill | 3/7/24 | Equity | $5,477,168 |
| NUSB | Nuveen UltraShort Income ETF | Nuveen | 3/6/24 | Fixed Income | $15,653,125 |
| NSCR | NuveenSustainable Core ETF | Nuveen | 3/6/24 | Equity | $5,734,520 |
| NPFI | NuveenPreferred and Income ETF | Nuveen | 3/6/24 | Fixed Income | $15,222,000 |
| NCPB | Nuveen CorePlus Bond ETF | Nuveen | 3/6/24 | Fixed Income | $29,819,640 |
| SPYT | DefianceS&P 500 Target Income ETF | Defiance ETFs | 3/7/24 | Equity | $8,952,795 |
| DIVP | CullenEnhanced Equity Income ETF | CullenCapital | 3/7/24 | Equity | $6,445,351 |
| IOPP | Simplify TaraIndia Opportunities ETF | Simplify | 3/5/24 | Equity | $3,207,526 |
| PCIG | Polen CapitalInternational Growth ETF | LitmanGregory | 3/15/24 | Equity | $25,196,220 |
| PCCE | Polen CapitalChina Growth ETF | LitmanGregory | 3/15/24 | Equity | $1,471,500 |
| TAXX | BondBloxxIR+M Tax-Aware Short Duration ETF | BondBloxx | 3/14/24 | Fixed Income | $41,417,000 |
| XIMR | FT Vest U.S.Equity Buffer & Premium Income ETF - March | FT Vest | 3/19/24 | Equity | $6,180,062 |
| FDND | FT Vest DowJones Internet & Target Income ETF | FT Vest | 3/21/24 | Equity | $1,020,736 |
| AMZZ | GraniteShares2x Long AMZN Daily ETF | GraniteShares | 3/18/24 | Equity | $3,639,157 |
| AMDL | GraniteShares2x Long AMD Daily ETF | GraniteShares | 3/18/24 | Equity | $7,832,020 |
| MSFL | GraniteShares2x Long MSFT Daily ETF | GraniteShares | 3/18/24 | Equity | $2,339,270 |
| AVXC | AvantisEmerging Markets ex-China Equity ETF | AmericanCentury | 3/21/24 | Equity | $3,041,010 |
| WZRD | OpportunisticTrader ETF | OT Advisors | 3/20/24 | Asset Allocation | $23,789,520 |
| NBSM | NeubergerBerman Small-Mid Cap ETF | NeubergerBerman | 3/21/24 | Equity | $157,043,080 |
| BCIL | BancreekInternational Large Cap ETF | Bancreek | 3/21/24 | Equity | $1,239,000 |
| MARM | FT Vest U.S.Equity Max Buffer ETF - March | FT Vest | 3/27/24 | Equity | $37,140,808 |
| KEAT | KeatingActive ETF | Keating | 3/27/24 | Equity | $62,755,784 |
| INRO | BlackRockU.S. Industry Rotation ETF | iShares | 3/28/24 | Equity | $5,469,750 |
| EVSM | Eaton VanceShort Duration Municipal Income ETF | MorganStanley | 3/25/24 | Fixed Income | $125,905,147 |
| EVTR | Eaton VanceTotal Return Bond ETF | MorganStanley | 3/25/24 | Fixed Income | $359,446,550 |
| EAGL | Eagle CapitalSelect Equity ETF | Eagle Capital | 3/25/24 | Equity | $1,822,411,898 |
| EHLS | Even HerdLong Short ETF | Even Herd | 4/2/24 | Alternatives | $46,262,200 |
| PBAP | PGIM USLarge-Cap Buffer 20 ETF - April | PGIM | 4/1/24 | Equity | $2,992,825 |
| APRP | PGIM USLarge-Cap Buffer 12 ETF - April | PGIM | 4/1/24 | Equity | $2,491,025 |
| AAPR | InnovatorEquity Defined Protection ETF - 2 Yr to April 2026 | Innovator | 4/1/24 | Equity | $23,495,020 |
| HAPR | InnovatorPremium Income 9 Buffer ETF - April | Innovator | 4/1/24 | Equity | $1,243,915 |
| LAPR | InnovatorPremium Income 15 Buffer ETF - April | Innovator | 4/1/24 | Fixed Income | $1,867,500 |
| ARLU | AllianzIMU.S. Equity Buffer15 Uncapped Apr ETF | AllianzInvestment Management | 4/1/24 | Equity | $8,718,500 |
| RVER | TrenchlessFund ETF | River1 | 4/3/24 | Equity | $14,928,780 |
| KOOL | North ShoreEquity Rotation ETF | Split Rock | 4/2/24 | Equity | $6,182,454 |
| FLAO | AllianzIMU.S. Equity 6 Month Floor5 Apr/Oct ETF | AllianzInvestment Management | 4/1/24 | Equity | $6,235,525 |
| CNEQ | AlgerConcentrated Equity ETF | Alger | 4/5/24 | Equity | $1,005,590 |
| ALAI | Alger AIEnablers & Adopters ETF | Alger | 4/5/24 | Equity | $1,004,200 |
| Total - 109 New ETFs | Total | $ 6,915,214,869 |
Source: FactSet & NYSE Internal Database and Consolidated Tape Statistics as of 3/31/2024
Active ETF Stat Pack
| Firms | |||
|---|---|---|---|
| # of Issuers | 279 | ||
| # of New Issuers 2023 | 18 | ||
| Products | Assets | ||
| # of ETFs | 1394 | AUM ($B) | $619.52 |
| # of New Launches 2023 | 109 | 3 Yr AUM CAGR | 43% |
| Avg. ER | 0.43% | 5 Yr AUM CAGR | 51% |
| Cash Flow | Trading | ||
| YTD Cash Flow ($B) | $64.71 | YTD ADV (Shares) | 210,684,475 |
| 3 Yr Cash Flow | $329.77 | YTD ADV ($) | $6.56 B |
| 5 Yr Cash Flow | $446.70 | YTD Avg. Spread (bps)* | 25.08 |
Source: Factset & NYSE Internal Database and Consolidated Tape Statistics as of 3/31/2024
*Simple average
Active, Semi-Transparent ETFs
| Ticker | Inception | Name | AUM | YTD Flows | 30 Day Median Spread (bps) | ADV (shares) | Structure | LMM | Expense Ratio |
|---|---|---|---|---|---|---|---|---|---|
| VNSE | 09/17/2020 | Natixis Vaughan Nelson Select ETF | $33,462,385 | -$686,221 | 14.86 | 2,749 | NYSE AMS | Citadel | 0.80% |
| VNMC | 09/17/2020 | Natixis Vaughan Nelson Mid Cap ETF | $4,293,380 | $367,708 | 19.03 | 264 | NYSE AMS | Citadel | 0.85% |
| ESGA | 07/15/2020 | American Century Sustainable Equity ETF | $181,582,902 | -$10,480,042 | 12.25 | 9,573 | NYSE AMS | Citadel | 0.39% |
| MID.ETF | 07/15/2020 | American Century Mid Cap Growth Impact ETF | $64,920,356 | $3,280,207 | 13.48 | 5,103 | NYSE AMS | Citadel | 0.45% |
| ESGY | 07/01/2021 | American Century Sustainable Growth ETF | $14,946,750 | $945,228 | 9.60 | 1,699 | NYSE AMS | Citadel | 0.39% |
| NDVG | 08/05/2021 | Nuveen Dividend Growth ETF | $10,698,957 | -$2,514,188 | 8.24 | 3,738 | NYSE AMS | Citadel | 0.65% |
| NSCS | 08/05/2021 | Nuveen Small Cap Select ETF | $6,851,468 | $0 | 10.13 | 151 | NYSE AMS | Citadel | 0.86% |
| NWLG | 08/05/2021 | Nuveen Winslow Large-Cap Growth ESG ETF | $7,227,750 | $0 | 8.89 | 405 | NYSE AMS | Citadel | 0.65% |
| SAEF | 11/16/2021 | Schwab Ariel ESG ETF | $21,831,600 | $1,615,100 | 34.28 | 2,811 | NYSE AMS | Flow Traders | 0.59% |
| IWLG | 06/23/2022 | IQ Winslow Large Cap Growth ETF | $28,059,540 | $1,607,010 | 13.60 | 734 | NYSE AMS | Citadel | 0.60% |
| IWFG | 06/23/2022 | IQ Winslow Focused Large Cap Growth ETF | $9,038,920 | $391,770 | 15.12 | 163 | NYSE AMS | Citadel | 0.65% |
| TSME | 10/05/2022 | Thrivent Small-Mid Cap ESG ETF | $163,025,828 | -$10,918,488 | 9.01 | 67,013 | NYSE AMS | RBC | 0.65% |
| JPSV | 03/08/2023 | JPMorgan Active Small Cap Value ETF | $15,834,000 | $1,344,700 | 6.92 | 733 | NYSE AMS | Citadel | 0.74% |
| LSGR | 06/29/2023 | Natixis Loomis Sayles Focused Growth ETF | $142,560,540 | $135,404,686 | 8.41 | 65,152 | NYSE AMS | Citadel | 0.59% |
| SGLC | 03/31/2023 | SGI U.S. Large Cap Core ETF | $91,910,840 | -$20,024,411 | 16.39 | 27,841 | NYSE AMS | GTS | 0.85% |
| FDG | 04/02/2020 | American Century Focused Dynamic Growth ETF | $208,954,856 | -$1,235,628 | 8.57 | 11,481 | NYSE AMS | Citadel | 0.45% |
| FLV | 04/02/2020 | American Century Focused Large Cap Value ETF | $211,886,181 | -$9,049,859 | 10.24 | 9,730 | NYSE AMS | Citadel | 0.42% |
| FBCG | 06/04/2020 | Fidelity Blue Chip Growth ETF | $1,411,825,355 | $244,745,391 | 8.71 | 336,632 | Fidelity Proxy | GTS | 0.59% |
| FBCV | 06/04/2020 | Fidelity Blue Chip Value ETF | $125,645,174 | $76,849 | 16.69 | 15,932 | Fidelity Proxy | GTS | 0.59% |
| FMIL | 06/04/2020 | Fidelity New Millennium ETF | $247,780,366 | $46,528,907 | 19.03 | 52,679 | Fidelity Proxy | GTS | 0.38% |
| FGRO | 02/04/2021 | Fidelity Growth Opportunities ETF | $284,236,659 | $18,785,956 | 25.42 | 62,531 | Fidelity Proxy | Citadel | 0.38% |
| FMAG | 02/04/2021 | Fidelity Magellan ETF | $86,745,793 | $24,473,177 | 8.48 | 38,172 | Fidelity Proxy | RBC | 0.59% |
| FPRO | 02/04/2021 | Fidelity Real Estate Investment ETF | $12,229,769 | -$1,031,773 | 12.95 | 2,842 | Fidelity Proxy | Citadel | 0.59% |
| FSMO | 02/04/2021 | Fidelity Small/Mid-Cap Opportunities ETF | $57,938,601 | $11,215,077 | 7.16 | 17,297 | Fidelity Proxy | RBC | 0.43% |
| FSST | 06/17/2021 | Fidelity Sustainability U.S. Equity ETF | $12,899,193 | $604,828 | 7.44 | 2,027 | Fidelity Proxy | RBC | 0.59% |
| FDWM | 06/17/2021 | Fidelity Women's Leadership ETF | $3,839,051 | $0 | 12.62 | 736 | Fidelity Proxy | RBC | 0.59% |
| TCHP | 08/05/2020 | T. Rowe Price Blue Chip Growth ETF | $545,349,793 | $19,337,839 | 7.84 | 92,669 | T Rowe Proxy | Virtu | 0.57% |
| TDVG | 08/05/2020 | T. Rowe Price Dividend Growth ETF | $397,082,188 | $29,670,096 | 5.78 | 56,097 | T Rowe Proxy | RBC | 0.50% |
| TEQI | 08/05/2020 | T. Rowe Price Equity Income ETF | $155,866,280 | $6,993,688 | 9.60 | 12,992 | T Rowe Proxy | Virtu | 0.54% |
| TGRW | 08/05/2020 | T. Rowe Price Growth Stock ETF | $73,493,894 | $6,981,832 | 7.11 | 10,140 | T Rowe Proxy | RBC | 0.52% |
| TSPA | 06/08/2021 | T. Rowe Price U.S. Equity Research ETF | $170,945,482 | $65,522,332 | 7.32 | 42,130 | T Rowe Proxy | RBC | 0.34% |
| IVRA | 12/22/2020 | Invesco Real Assets ESG ETF | $4,708,674 | $1,522,120 | 45.85 | 3,376 | Fidelity Proxy | Citadel | 0.59% |
| LOPP | 02/01/2021 | Gabelli Love Our Planet & People ETF | $12,077,760 | $0 | 31.15 | 436 | ActiveShares | GTS | 0.00% |
| GGRW | 02/16/2021 | Gabelli Growth Innovators ETF | $4,244,390 | $334,100 | 31.18 | 4,701 | ActiveShares | GTS | 0.90% |
| GAST | 01/05/2022 | Gabelli Asset ETF | $4,934,680 | $0 | 31.55 | 32 | ActiveShares | GTS | 0.00% |
| GABF | 05/11/2022 | Gabelli Financial Services Opportunities ETF | $13,166,280 | $2,847,385 | 28.70 | 4,125 | ActiveShares | GTS | 0.04% |
| GCAD | 01/03/2023 | Gabelli Commercial Aerospace & Defense ETF | $4,957,095 | $274,610 | 29.91 | 536 | ActiveShares | GTS | 0.00% |
| FRTY | 03/01/2021 | Alger Mid Cap 40 ETF | $33,128,750 | $979,500 | 61.55 | 9,973 | ActiveShares | Virtu | 1.19% |
| ATFV | 05/04/2021 | Alger 35 ETF | $16,357,275 | $1,294,875 | 30.72 | 6,768 | ActiveShares | Virtu | 1.83% |
| AWEG | 03/07/2023 | Alger Weatherbie Enduring Growth ETF | $4,546,600 | $0 | 63.85 | 75 | ActiveShares | Virtu | 1.25% |
| CLIA | 05/09/2023 | Veridien Climate Action ETF | $23,673,442 | $567,117 | 59.14 | 2,953 | ActiveShares | GTS | 0.85% |
| REIT | 02/26/2021 | ALPS Active REIT ETF | $23,693,600 | $5,223,850 | 25.19 | 7,301 | Blue Tractor | GTS | 0.68% |
| STNC | 03/16/2021 | Hennessy Stance ESG Large Cap ETF | $169,719,394 | $106,583,363 | 46.24 | 7,952 | Blue Tractor | GTS | 0.85% |
| DYTA | 03/30/2023 | SGI Dynamic Tactical ETF | $59,237,811 | -$52,915,308 | 19.42 | 42,975 | Blue Tractor | GTS | 0.95% |
| PFUT | 05/26/2021 | Putnam Sustainable Future ETF | $238,405,853 | $9,511,500 | 16.11 | 34,167 | Fidelity Proxy | Virtu | 0.64% |
| PLDR | 05/26/2021 | Putnam Sustainable Leaders ETF | $474,716,712 | $132,789 | 9.35 | 63,957 | Fidelity Proxy | RBC | 0.59% |
| PGRO | 05/26/2021 | Putnam Focused Large Cap Growth ETF | $58,377,711 | $7,212,708 | 9.27 | 13,228 | Fidelity Proxy | RBC | 0.56% |
| PVAL | 05/26/2021 | Putnam Focused Large Cap Value ETF | $427,449,587 | $135,009,500 | 7.40 | 124,703 | Fidelity Proxy | Virtu | 0.56% |
| HFGO | 11/09/2021 | Hartford Large Cap Growth ETF | $115,898,243 | -$418,148 | 16.16 | 1,445 | Fidelity Proxy | Citadel | 0.60% |
| SEMI | 03/30/2022 | Columbia Seligman Semiconductor and Technology ETF | $36,566,490 | $1,805,150 | 30.15 | 5,587 | Fidelity Proxy | Virtu | 0.75% |
| CAPE | 04/05/2022 | DoubleLine Shiller CAPE U.S. Equities ETF | $383,346,600 | -$85,032,800 | 12.43 | 45,864 | ActiveShares | Citadel | 0.65% |
| FMCX | 04/25/2022 | FMC Excelsior Focus Equity ETF | $90,778,800 | $441,800 | 22.76 | 702 | ActiveShares | GTS | 0.70% |
| BYRE | 05/19/2022 | Principal Real Estate Active Opportunities ETF | $9,065,823 | $466,392 | 26.27 | 799 | Fidelity Proxy | Virtu | 0.65% |
| JHAC | 11/02/2023 | John Hancock Fundamental All Cap Core ETF | $3,105,473 | $547,538 | 9.81 | 1,218 | Fidelity Proxy | Virtu | 0.72% |
Total/Average | $7,015,120,893 | $700,339,814 | 19.24 | 1,335,089 | 0.62% |
Source: Factset & NYSE Internal Database and Consolidated Tape Statistics as of 3/31/2024
*Simple average