As the ETF industry enters its 30th year and the active market enters its 16th year, the New York Stock Exchange made five more bold predictions for the active ETF market in 2023:
Assets under management (AUM): Grow from $340 billion to exceed $450 billion by year end 2023
Full-year cash flow: Make it three years in a row with over $80 billion
Mutual fund to ETF conversions: 15+ issuers will complete mutual fund to ETF conversions totaling over $20 billion
Active semi-transparent: 10+ ETFs will launch, and assets will exceed $7.5 billion
Growth milestone: At least two issuers will eclipse $75 billion in AUM
So how did we do through quarter one?
Assets have grown to over $380 billion. Give us three more quarters of comparable growth and we will have hit the mark.
Quarter one cash flow totaled $26.5 billion. A pace that sets us on course for the full year and is ahead of last year’s quarter one total.
The industry welcomed six active ETFs from five separate issuers via conversion in quarter one, with combined assets on conversion of $1.0 billion. A healthy start, but we will need to see assets climb.
Five new active semi-transparent ETFs came to market in Q1 2023, and assets now stand at $6.2 billion. Despite continued investment limitations, the broader market had nearly matched the full-year 2022 total with nearly $1 billion in new cash flow in Q1 2023.
Dimensional ended the quarter with $82.8 billion in assets. We are halfway there. JPMorgan continues to grow and now sits within striking distance with $66.4 billion.
Beyond our bold predictions, there are three additional stats from the quarter that stood out to us:
Active ETF cash flow as a percentage of total ETF industry cash flow: 33%, a new record for a quarter
Firms with positive cash flow: 149 firms, or nearly 70% of firms; down from 80% for full year 2022
ETFs with positive cash flow: 534 active ETFs, or slightly over 50% of all ETFs; down from 649 for full year 2022
Quarterly Active ETF Cash Flows
Source: Factset as of 3/31/2023
Passive vs Active Quarterly Cash Flows
Source: Factset as of 3/31/2023
The actively managed ETF industry grew across most asset classes through Q1 2023. Equity flows continued to be the story of the industry, leading the way with $22.2 billion. Investors favored domestic equity exposure (+$16.6 billion) to global (+$6.2 billion). Notably, ETFs that focused on core building block exposures, value and offered an options overlay led the way. Fixed income flows, $6.1 billion, rallied from a slow 2022 (+$8.4 billion). Investors demonstrated renewed interest in core/intermediate-term strategies and continued interest in short-term and CLO strategies. Alternatives, $0.04 billion, lost their record 2022 flow momentum. The combination of managed futures and real return strategies that were in vogue in 2022 experienced a more muted start to the year. Commodities continued a trend from the second half of 2022 with outflows of $1.3 billion.
Active ETF Flows by Asset Class
Source: Factset as of 3/31/2023
Global Equity
Domestic Equity
Domestic Fixed Income
Global Fixed Income
Commodities
Asset Allocation
Alternatives
Currency
AUM Leader
Dimensional
Dimensional
JPMorgan
First Trust
Invesco
Cabana
Advanced Research (ARIS)
WisdomTree
AUM Leader $B
$24.7
$53.1
$30.6
$15.9
$5.7
$1.2
$1.1
$0.4
Q1 CF Leader
Dimensional
JPMorgan
JPMorgan
Dimensional
Neuberger Berman
ETF Architect
Advanced Research (ARIS)
Simplify
Q1 CF Leader $B
$3.3
$7.0
$1.4
$0.8
$0.1
$0.03
$0.1
$0.01
Source: Factset as of 3/31/2023
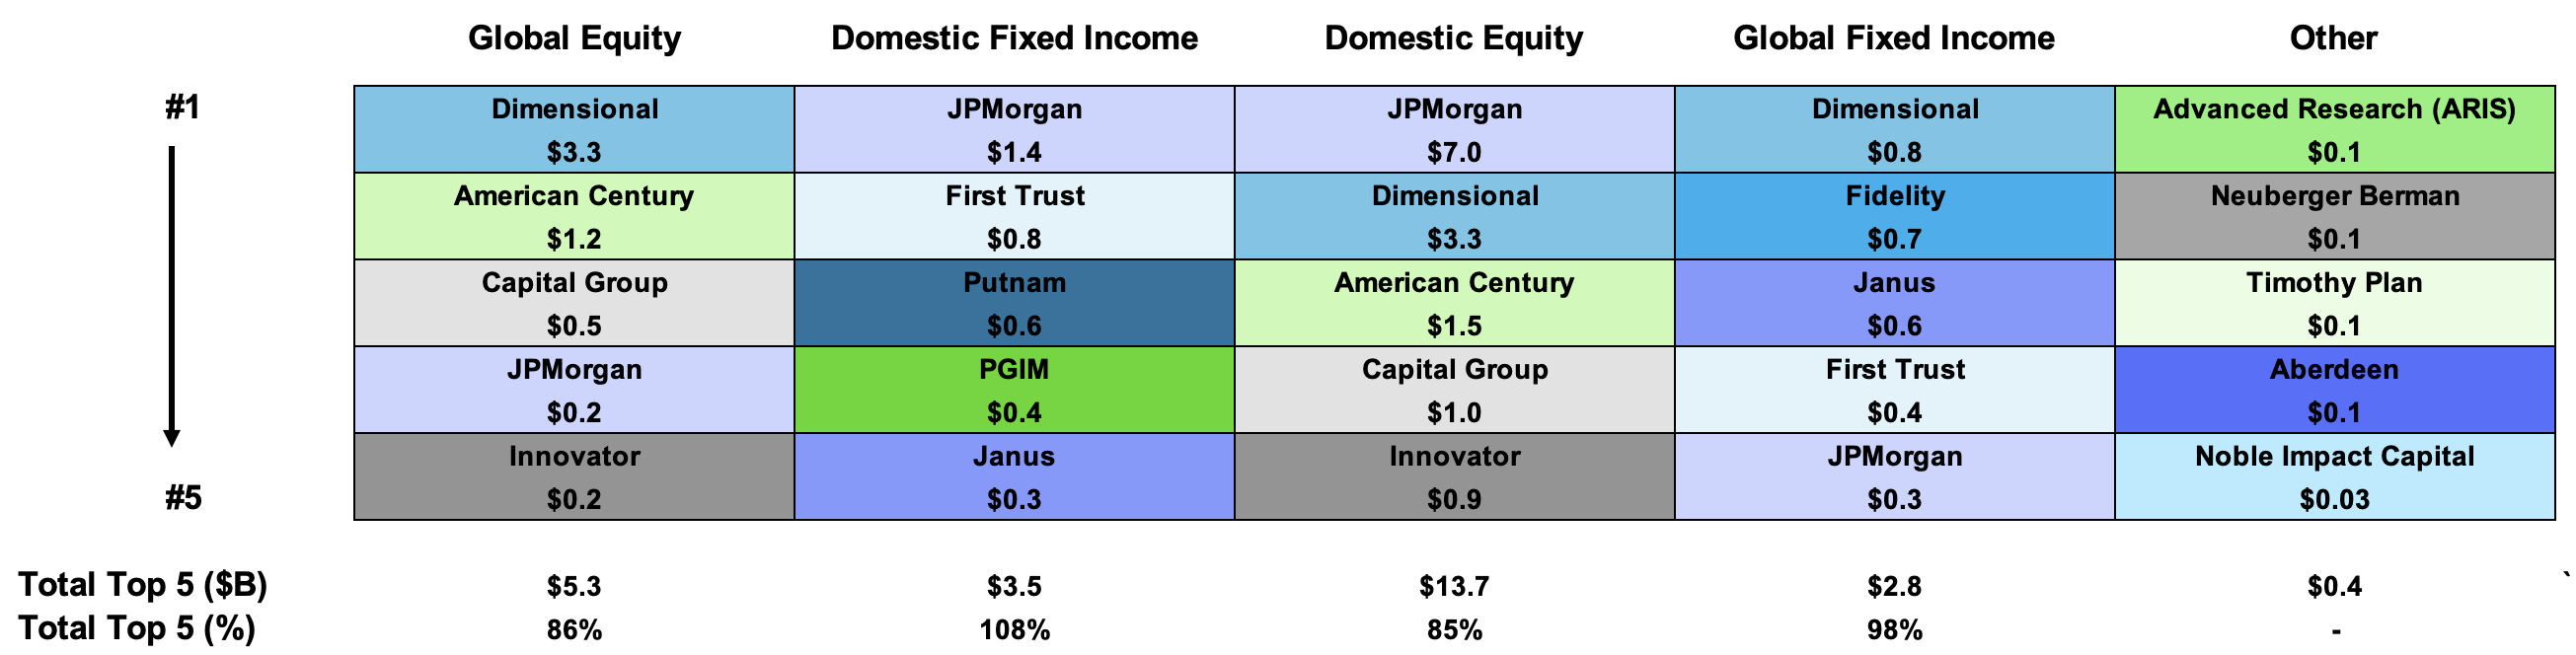
At the issuer level, JPMorgan and Dimensional again positioned themselves to be cash flow leaders in 2023, taking in $8.7 billion and $7.4 billion, respectively. The two firms demonstrated leadership in different ways, as Dimensional had inflows into all 30 ETFs during the quarter while JPMorgan had two of the top three biggest cash flow winners of the quarter: JEPI (+$6.0 billion), JEPQ (+1.0 billion) and JPST (+$0.9 billion). American Century/Avantis (+$2.8 billion), Capital Group (+$1.8 billion), First Trust (+$1.4 billion), Putnam (+$1.3 billion) and Innovator (+$1.0 billion) rounded out the list of issuers with greater than $1 billion in cash flows for their actively managed lineups. American Century/Avantis and Capital Group both saw flows across their lineups into their broader market, lower cost actively managed ETFs. Notably, neither firm had an ETF with an outflow during the quarter. First Trust primary flows were across short duration and core fixed income along with a range of its defined outcome strategies. Putnam nearly cracked the top five for the first time with strong inflows into its equity and fixed income ESG ETFs. Innovator’s flows were largely driven by its US-focused Jan-March Power Buffer defined outcome strategies.
Q1 2023 Cash Flow Leaders by Asset Class
During Q1, over 65% of issuers experienced positive cash flows and nearly a fourth had cash flows in excess of $25 million. In addition to the seven issuers mentioned above, Janus Henderson (+$0.8 billion), Fidelity (+$0.8 billion), PGIM (+$0.5 billion), Amplify (+$0.3 billion) and AXS (+0.3 billion) all crossed $0.25 billion in net cash flows. These five issuers found varied paths to their success, from ultra-short fixed income (PGIM), dividend income (Amplify), AAA-rated CLOs (Janus Henderson), core fixed income (Fidelity) and single ETF/stock inverse (AXS).
Ticker
Top 10 ETFs by Cash Flow ($B)
Q1 2023 ($M)
JEPI
JPMorgan Equity Premium Income ETF
$6,079
DFAC
Dimensional U.S. Core Equity 2 ETF
$1,185
JEPQ
J.P. Morgan Nasdaq Equity Premium Income ETF
$978
JPST
JPMorgan Ultra-Short Income ETF
$973
AVUV
Avantis U.S. Small Cap Value ETF
$822
FBND
Fidelity Total Bond ETF
$764
DFIC
Dimensional International Core Equity 2 ETF
$748
JAAA
Janus Detroit Street Trust Janus Henderson AAA CLO ETF
$595
AVUS
Avantis U.S. Equity ETF
$558
DFCF
Dimensional Core Fixed Income ETF
$558
Source: Factset as of 12/31/2022
Ticker
Bottom 10 ETFs by Cash Flow ($B)
Q1 2023 ($M)
SRLN
SPDR Blackstone Senior Loan ETF
$(895)
COMT
iShares U.S. ETF Trust iShares GSCI Commodity Dynamic Roll Strategy ETF
$(846)
ICSH
BlackRock Ultra Short-Term Bond ETF
$(798)
MINT
PIMCO Enhanced Short Maturity Active ETF
$(416)
FTSL
First Trust Senior Loan Fund
$(329)
FTGC
First Trust Global Tactical Commodity Strategy Fund
Invesco Optimum Yield Diversified Commodity Strategy No K-1 ETF
$(170)
At the product level, over 50% of active ETFs saw positive flows for the quarter and 114 experienced flows over $50 million (often viewed as a general break-even measure for an ETF). The industry’s asset weighted expense ratio stayed steady at 0.44% through the quarter. Nearly 80% of all cash flows went into ETFs with expense ratios below the industry average. In spite of this, only six of the 54 ETFs launched during the quarter offered an expense ratio below the industry average.
Expense Ratio
3/31/23 AUM
Q1 2023 CF
% AUM
% CF
# ETFs
0-25
$132,955,627,003
$8,552,166,671
35%
32%
106
26-50
$119,264,618,065
$13,048,369,517
31%
49%
230
51-75
$68,863,405,209
$3,231,728,928
18%
12%
278
76+
$59,829,416,208
$1,688,146,285
16%
6%
403
Expense Ratio
3/31/22 AUM
Q1 2022 CF
% AUM
% CF
# ETFs
0-25
$91,257,110,698
$6,770,621,100
30%
27%
79
26-50
$79,634,437,021
$7,863,149,615
26%
31%
176
51-75
$78,772,747,631
$5,079,115,244
26%
20%
202
76+
$54,535,508,871
$5,492,425,176
18%
22%
319
Source: Factset as of 3/31/2023
Q1 2023 Launch Monitor
Domestic Equity
21 ETFs Launched
$1.3 B Assets Raised
Domestic Fixed Income
4 ETFs Launched
$0.7 B Assets Raised
Alternatives
4 ETFs Launched
$75 M Assets Raised
Int'l/Global Equity
14 ETFs Launched
$265 M Assets Raised
Int'l/Global Fixed Income
5 ETFs Launched
$270 M Assets Raised
Asset Allocation
5 ETFs Launched
$212 M Assets Raised
Source: FactSet as of 3/31/2023, figures include MF-ETF conversions; Other includes Asset Allocation, Commodities & Currencies
In the first quarter of 2023, 54 actively managed ETFs launched raising $2.8 billion in assets. Launches came from 34 different issuers, including six first-time issuers. ETF development continued to focus on equities with nearly 65% of new ETFs focused on the asset class. During the quarter, Putnam launched the most ETFs and also raised the most assets, totaling five and $0.8 billion, respectively.
Q1 2023 ETF Launches
Ticker
Name
Issuer
Launch Date
Asset Class
AUM
GCAD
Gabelli Commercial Aerospace & Defense ETF
Gabelli
01/03/2023
Equity
$3,598,610
WCEO
Hypatia Women CEO ETF
Hypatia Capital
01/09/2023
Equity
$2,030,400
ENAV
Mohr Sector Navigator ETF
Mohr Funds
01/11/2023
Equity
$26,676,663
ZSB
USCF Sustainable Battery Metals Strategy Fund
USCF
01/11/2023
Commodities
$2,335,200
MEMX
Matthews Emerging Markets ex China Active ETF
Matthews Asia
01/11/2023
Equity
$3,966,080
CLOA
BlackRock AAA CLO ETF
iShares
01/12/2023
Fixed Income
$30,231,240
PRFD
PIMCO Preferred & Capital Securities Active ETF
PIMCO
01/19/2023
Fixed Income
$46,170,000
PCRB
Putnam ESG Core Bond ETF
Putnam
01/20/2023
Fixed Income
$460,237,650
PHYD
Putnam ESG High Yield ETF
Putnam
01/20/2023
Fixed Income
$100,984,095
PULT
Putnam ESG Ultra Short ETF
Putnam
01/20/2023
Fixed Income
$118,889,021
PPEM
Putnam PanAgora ESG Emerging Markets Equity ETF
Putnam
01/20/2023
Equity
$18,552,080
PPIE
Putnam PanAgora ESG International Equity ETF
Putnam
01/20/2023
Equity
$128,582,668
GDEF
Goldman Sachs Defensive Equity ETF
GSAM
01/23/2023
Equity
$6,548,390
GJAN
FT Cboe Vest U.S. Equity Moderate Buffer ETF - January
FT Cboe Vest
01/23/2023
Equity
$173,330,761
CLOZ
Panagram BBB-B CLO ETF
Panagram
01/24/2023
Fixed Income
$67,608,000
TPMN
Timothy Plan Market Neutral ETF
Timothy Plan
01/25/2023
Alternatives
$60,535,917
FTBD
Fidelity Tactical Bond ETF
Fidelity
01/26/2023
Fixed Income
$14,769,521
MEDX
Horizon Kinetics Medical ETF
Horizon Kinetics
01/30/2023
Equity
$18,338,313
SPAQ
Horizon Kinetics SPAC Active ETF
Horizon Kinetics
01/30/2023
Equity
$14,120,221
FEBT
AllianzIM U.S. Large Cap Buffer10 Feb ETF
Allianz Investment Management
02/01/2023
Equity
$33,072,928
FEBW
AllianzIM U.S. Large Cap Buffer20 Feb ETF
Allianz Investment Management
02/01/2023
Equity
$52,602,480
CVSE
Calvert US Select Equity ETF
Morgan Stanley
02/01/2023
Equity
$27,439,500
CVSB
Calvert Ultra-Short Investment Grade ETF
Morgan Stanley
02/01/2023
Fixed Income
$21,727,040
LALT
First Trust Multi-Strategy Alternative ETF
First Trust
02/01/2023
Alternatives
$995,390
RYSE
Cboe Vest 10 Year Interest Rate Hedge ETF
Cboe Vest
02/03/2023
Alternatives
$3,257,675
SROI
Calamos Antetokounmpo Global Sustainable Equities ETF
Calamos
02/06/2023
Equity
$7,502,994
KRUZ
Unusual Whales Subversive Republican Trading ETF
Subversive
02/07/2023
Equity
$4,798,300
NANC
Unusual Whales Subversive Democratic Trading ETF
Subversive
02/07/2023
Equity
$6,206,075
RSBT
Return Stacked Bonds & Managed Futures ETF
Return Stacked
02/08/2023
Alternatives
$10,005,270
SURI
Simplify Propel Opportunities ETF
Simplify
02/08/2023
Asset Allocation
$57,208,660
CAMX
Cambiar Aggressive Value ETF
Cambiar Funds
02/13/2023
Equity
$46,076,431
SUPP
Engine No. 1 Transform Supply Chain ETF
Engine No. 1
02/15/2023
Equity
$9,644,934
NVIR
Horizon Kinetics Energy and Remediation ETF
Horizon Kinetics
02/22/2023
Equity
$2,383,095
BEMB
iShares J.P. Morgan Broad USD Emerging Markets Bond ETF
iShares
02/24/2023
Fixed Income
$40,402,000
LJIM
Long Cramer Tracker ETF
Tuttle Capital Management
03/02/2023
Equity
$987,391
SJIM
Inverse Cramer Tracker ETF
Tuttle Capital Management
03/02/2023
Equity
$5,542,871
MART
AllianzIM U.S. Large Cap Buffer10 Mar ETF
Allianz Investment Management
03/01/2023
Equity
$7,607,760
MARW
AllianzIM U.S. Large Cap Buffer20 Mar ETF
Allianz Investment Management
03/01/2023
Equity
$27,793,480
CAOS
Alpha Architect Tail Risk ETF
Alpha Architect
03/06/2023
Asset Allocation
$147,777,422
JPSV
JPMorgan Active Small Cap Value ETF
JPMAM
03/08/2023
Equity
$10,184,550
AWEG
Alger Weatherbie Enduring Growth ETF
Alger
03/07/2023
Equity
$3,108,625
BSVO
EA Bridgeway Omni Small-Cap Value ETF
Bridgeway
03/13/2023
Equity
$734,704,427
JCHI
JPMorgan Active China ETF
JPMAM
03/16/2023
Equity
$13,221,000
FUSI
American Century Multisector Floating Income ETF
American Century
03/16/2023
Fixed Income
$20,040,960
GMAR
FT Cboe Vest U.S. Equity Moderate Buffer ETF - March
FT Cboe Vest
03/20/2023
Domestic
$69,358,860
XMAR
FT Cboe Vest U.S. Equity Enhance & Moderate Buffer ETF - March
FT Cboe Vest
03/20/2023
Domestic
$112,886,310
BIGB
Roundhill Big Bank ETF
Roundhill
03/21/2023
Domestic
$4,102,944
BITC
Bitwise Bitcoin Strategy Optimum Roll ETF
Bitwise
03/21/2023
Global
$626,775
LOWV
AB US Low Volatility Equity ETF
AllianceBernstein
03/22/2023
Domestic
$5,555,152
HIDV
AB US High Dividend ETF
AllianceBernstein
03/22/2023
Domestic
$6,057,505
FWD
AB Disruptors ETF
AllianceBernstein
03/22/2023
Global
$5,120,524
DYTA
SGI Dynamic Tactical ETF
Summit Global
03/30/2023
Global
$2,509,000
HARD
Simplify Commodities Strategy No K-1 ETF
Simplify
03/28/2023
Global
$3,127,900
SGLC
SGI U.S. Large Cap Core ETF
Summit Global
03/31/2023
Domestic
$2,500,000
Total - 54 New ETFs
$2,803,641,057
Active ETF Stat Pack
Firms
# of Issuers
220
# of New Issuers 2023
10
Products
Assets
# of ETFs
1017
AUM ($B)
$380.91
# of New Launches 2023
54
3 Yr AUM CAGR
60%
Avg. ER
0.44%
5 Yr AUM CAGR
51%
Cash Flow
Trading
YTD Cash Flow ($B)
$26.52
YTD ADV (Shares)
138.760.650
3 Yr Cash Flow
$254.52
YTD ADV ($)
$4.62 B
5 Yr Cash Flow
$315.34
YTD Avg. Spread (bps)*
31.09
Source: Factset & NYSE Internal Database and Consolidated Tape Statistics as of 3/31/2023
*Simple average
Active, Semi-Transparent ETFs
Ticker
Inception
Name
AUM
YTD Cash Flow
30-Day Med. Spread (bps)
ADV (shares)
Structure
LMM
Expense Ratio
EQOP
09/17/2020
Natixis U.S. Equity Opportunities ETF
$9,109,618
-$41,315
14.68
60
NYSE AMS
Citadel
0.85%
VNSE
09/17/2020
Natixis Vaughan Nelson Select ETF
$21,122,750
$7,945,821
11.52
9,328
NYSE AMS
Citadel
0.80%
VNMC
09/17/2020
Natixis Vaughan Nelson Mid Cap ETF
$7,173,259
$0
14.22
169
NYSE AMS
Citadel
0.85%
ESGA
07/15/2020
American Century Sustainable Equity ETF
$117,260,400
$1,451,226
12.90
4,177
NYSE AMS
Citadel
0.39%
MID
07/15/2020
American Century Mid Cap Growth Impact ETF
$36,388,960
$5,445,129
12.55
3,832
NYSE AMS
Citadel
0.45%
ESGY
07/01/2021
American Century Sustainable Growth ETF
$7,364,240
$340,530
9.51
323
NYSE AMS
Citadel
0.39%
NDVG
08/05/2021
Nuveen Dividend Growth ETF
$7,998,688
$250,321
9.22
339
NYSE AMS
Citadel
0.64%
NSCS
08/05/2021
Nuveen Small Cap Select ETF
$5,625,698
$0
14.68
43
NYSE AMS
Citadel
0.85%
NWLG
08/05/2021
Nuveen Winslow Large-Cap Growth ESG ETF
$5,085,300
$188,861
10.20
255
NYSE AMS
Citadel
0.64%
NUGO
09/28/2021
Nuveen Growth Opportunities ETF
$2,449,429,600
$84,418,259
10.85
131,751
NYSE AMS
Citadel
0.55%
SAEF
11/16/2021
Schwab Ariel ESG ETF
$14,133,777
$427,650
44.73
1,881
NYSE AMS
Flow Traders
0.59%
IWLG
06/23/2022
IQ Winslow Large Cap Growth ETF
$18,386,550
$3,717,510
25.01
2,246
NYSE AMS
Citadel
0.60%
IWFG
06/23/2022
IQ Winslow Focused Large Cap Growth ETF
$6,087,207
$0
25.61
125
NYSE AMS
Citadel
0.65%
TSME
10/05/2022
Thrivent Small-Mid Cap ESG ETF
$123,208,400
$49,986,314
12.72
30,299
NYSE AMS
RBC
0.65%
JPSV
03/08/2023
JPMorgan Active Small Cap Value ETF
$10,357,367
$719,850
9.15
1,958
NYSE AMS
Citadel
0.74%
SGLC
03/31/2023
SGI U.S. Large Cap Core ETF
$2,531,790
$2,499,975
24.41
#NAME?
NYSE AMS
GTS
0.85%
FDG
04/02/2020
American Century Focused Dynamic Growth ETF
$138,504,097
$133,080
10.72
7,159
ActiveShares
Citadel
0.45%
FLV
04/02/2020
American Century Focused Large Cap Value ETF
$225,437,226
$7,332,880
10.27
8,859
ActiveShares
Citadel
0.42%
FBCG
06/04/2020
Fidelity Blue Chip Growth ETF
$494,560,500
$26,256,031
34.31
89,476
Fidelity Proxy
GTS
0.59%
FBCV
06/04/2020
Fidelity Blue Chip Value ETF
$132,162,500
-$599,434
31.14
17,028
Fidelity Proxy
GTS
0.59%
FMIL
06/04/2020
Fidelity New Millennium ETF
$92,430,000
$4,490,022
28.68
12,809
Fidelity Proxy
GTS
0.59%
FGRO
02/04/2021
Fidelity Growth Opportunities ETF
$145,090,500
$74,459,622
15.40
121,475
Fidelity Proxy
Citadel
0.59%
FMAG
02/04/2021
Fidelity Magellan ETF
$43,500,000
-$945,920
12.19
6,372
Fidelity Proxy
RBC
0.59%
FPRO
02/04/2021
Fidelity Real Estate Investment ETF
$15,933,380
-$1,025,699
14.81
3,295
Fidelity Proxy
Citadel
0.59%
FSMO
02/04/2021
Fidelity Small/Mid-Cap Opportunities ETF
$30,886,500
$2,218,239
8.97
6,031
Fidelity Proxy
RBC
0.59%
FSST
06/17/2021
Fidelity Sustainability U.S. Equity ETF
$8,806,680
$952,512
13.70
1,420
Fidelity Proxy
RBC
0.59%
FDWM
06/17/2021
Fidelity Women's Leadership ETF
$4,948,928
$2,106,613
13.82
314
Fidelity Proxy
RBC
0.59%
TCHP
08/05/2020
T. Rowe Price Blue Chip Growth ETF
$330,324,500
$27,717,787
9.68
105,165
T Rowe Proxy
Virtu
0.57%
TDVG
08/05/2020
T. Rowe Price Dividend Growth ETF
$305,639,054
$32,038,535
8.58
44,773
T Rowe Proxy
RBC
0.50%
TEQI
08/05/2020
T. Rowe Price Equity Income ETF
$103,708,498
$8,071,148
9.65
14,827
T Rowe Proxy
Virtu
0.54%
TGRW
08/05/2020
T. Rowe Price Growth Stock ETF
$42,096,950
$1,238,930
10.86
6,826
T Rowe Proxy
RBC
0.52%
TSPA
06/08/2021
T. Rowe Price U.S. Equity Research ETF
$24,925,152
$1,826
10.65
2,431
T Rowe Proxy
RBC
0.52%
IVDG
12/22/2020
Invesco Focused Discovery Growth ETF
$603,006
-$102,860
10.63
342
Invesco Model
Citadel
0.59%
IVSG
12/22/2020
Invesco Select Growth ETF
$915,300
-$10,160
10.16
1,255
Invesco Model
Citadel
0.48%
IVLC
12/22/2020
Invesco US Large Cap Core ESG ETF
$5,865,600
-$360
16.07
656
Fidelity Proxy
Citadel
0.48%
IVRA
12/22/2020
Invesco Real Assets ESG ETF
$3,120,217
$0
41.07
988
Fidelity Proxy
Citadel
0.59%
LOPP
02/01/2021
Gabelli Love Our Planet & People ETF
$12,736,791
$0
39.54
349
ActiveShares
GTS
0.90%
GGRW
02/16/2021
Gabelli Growth Innovators ETF
$2,382,422
$0
42.05
101
ActiveShares
GTS
0.90%
GAST
01/05/2022
Gabelli Asset ETF
$4,638,648
$0
45.44
23
ActiveShares
GTS
0.90%
GABF
05/11/2022
Gabelli Financial Services Opportunities ETF
$5,752,777
$144,465
64.13
166
ActiveShares
GTS
0.00%
GCAD
01/03/2023
Gabelli Commercial Aerospace & Defense ETF
$3,628,466
$1,142,855
38.61
1,057
ActiveShares
GTS
0.90%
FRTY
03/01/2021
Alger Mid Cap 40 ETF
$28,939,138
-$974,000
55.19
9,894
ActiveShares
Virtu
0.60%
ATFV
05/04/2021
Alger 35 ETF
$9,711,225
-$181,000
65.85
262
ActiveShares
Virtu
0.55%
AWEG
03/07/2023
Alger Weatherbie Enduring Growth ETF
$3,184,123
$2,108,625
72.18
9,280
ActiveShares
Virtu
0.65%
REIT
02/26/2021
ALPS Active REIT ETF
$18,148,249
$744,050
30.44
3,208
Blue Tractor
GTS
0.68%
STNC
03/16/2021
Hennessy Stance ESG Large Cap ETF
$44,743,595
$539,264
13.02
2,079
Blue Tractor
GTS
0.85%
DYTA
03/30/2023
SGI Dynamic Tactical ETF
#NAME?
$0
27.96
#NAME?
Blue Tractor
GTS
0.95%
PFUT
05/26/2021
Putnam Sustainable Future ETF
$161,080,978
$151,979,163
32.59
9,025
Fidelity Proxy
Virtu
0.64%
PLDR
05/26/2021
Putnam Sustainable Leaders ETF
$346,170,848
$340,009,879
10.97
257,085
Fidelity Proxy
RBC
0.59%
PGRO
05/26/2021
Putnam Focused Large Cap Growth ETF
$26,940,540
$15,095,596
11.21
14,220
Fidelity Proxy
RBC
0.55%
PVAL
05/26/2021
Putnam Focused Large Cap Value ETF
$148,602,947
$10,599,711
29.68
22,965
Fidelity Proxy
Virtu
0.55%
HFGO
11/09/2021
Hartford Large Cap Growth ETF
$84,011,113
$0
30.22
1,328
Fidelity Proxy
Citadel
0.59%
SEMI
03/30/2022
Columbia Seligman Semiconductor and Technology ETF
$18,220,759
$1,342,000
36.18
2,948
Fidelity Proxy
Virtu
0.75%
CAPE
04/05/2022
DoubleLine Shiller CAPE U.S. Equities ETF
$244,875,939
$21,181,200
17.28
53,380
ActiveShares
Citadel
0.65%
FMCX
04/25/2022
FMC Excelsior Focus Equity ETF
$73,443,668
-$69,300
17.88
235
ActiveShares
GTS
0.70%
BYRE
05/19/2022
Principal Real Estate Active Opportunities ETF
$5,063,389
$0
25.30
347
Fidelity Proxy
Virtu
0.65%
Total/Average
$6,235,506,803
$885,345,431
23.02
1,026,239
0.63%
Source: Factset & NYSE Internal Database and Consolidated Tape Statistics as of 3/31/2023
Missed our Active ETF Webinar series or latest podcast series? Visit the redesigned HomeofETFs.com to catch up.
Hear from ETF experts including active ETF structure providers, fund sponsors (American Century, Alger, Fidelity, PIMCO and T. Rowe Price), liquidity providers (Flow Traders and Jane Street), and service providers (BBH, BNY Mellon and State Street).