At the beginning of this year, the New York Stock Exchange made five bold predictions for the active ETF market in 2022:
Assets under management (AUM): Grow from $293.1 billion at the start of the year to exceed $425 billion by year end 2022
Full-year cash flow: Another big year with over $80 billion in new cash flow
Mutual fund to ETF conversions: 10+ issuers will complete mutual fund to ETF conversions totaling over $20 billion
Active semi-transparent: 20+ ETFs will launch, and assets will exceed $10 billion
Growth milestone: At least one issuer will eclipse $60 billon in AUM
So how did we do in 2022?
Assets have grown to over $340 billion. Solid improvement, yet short of our prediction. We all could have used a stronger second-half market rally.
Full-year cash flow exceeded $80 billion, ending the year at $85.5 billion. Importantly, flows continued to surpass the broader ETF market share representing ~14% of total industry cash flows.
The industry welcomed 17 active ETFs from 13 separate issuers via conversion from mutual funds, with combined assets on conversion of $19.9 billion. A flurry of second-half conversions carried this prediction over the line.
Nine new active semi-transparent ETFs came to market in 2022 and assets now stand at $4.8 billion. The broader market had nearly $1 billion in new cash flow in 2022, however the current investable asset class limitation to U.S. equity appears to be a real headwind for product development.
Dimensional ended the year with $72.4 billion in assets. Easily eclipsing our prediction of a single issuer over $60 billion. As a bonus, JPMorgan was just short, ending the year with $56.9 billion in AUM.
Three for five is respectable and an improvement over our two for five performance in 2021. All told, despite plenty of challenges, 2022 was another strong year for the active ETF market.
Beyond our bold predictions, there are three additional stats from the year that stood out to us:
Firms with postive cash flow: 149 firms, or nearly 80% of firms; up from 75% at the midway point of the year
ETFs with postive cash flow: 649 active ETFs, or nearly 70% of all ETFs; up from 655 at the mid way point of the year
ETFs with cash flow over $100 million: 158 active ETFs in 2022 vs. 135 active ETFs in 2021
Quarterly Active ETF Cash Flows
Source: Factset as of 12/31/2022
Total Annual Flows
Source: Factset as of 12/31/2022
The actively managed ETF industry grew across nearly all asset classes throughout 2022. Equity flows continued to be the story of the industry, leading the way with $70.9 billion. Investors favored domestic equity exposure (+$47.6 billion) to global (+$23.3 billion) and value to growth. Notably, ETFs that focused on yield through a dividend tilt and/or an options overlay led the industry. Fixed income flows, $8.4 billion, rallied from their mid-year lows despite outflows from global fixed income. The flows that did come in favored ultra and short-term ETFs as well as municipals. Alternatives, $3.1 billion, gained their largest cash flow on record. Investors poured three times the amount of money into these ETFs than in the prior five years combined. Flows favored a combination of managed futures and real return strategies that focus on minimizing the impact of rising rates and inflation. Commodities reversed course in the second half with inflows of $5.6 billion at the start of the period, ceding to outflows in the second half and $2.8 billion in net 2022 flows.
Active ETF Flows by Asset Class
Source: Factset as of 12/31/2022
Global Equity
Domestic Equity
Domestic Fixed Income
Global Fixed Income
Commodities
Asset Allocation
Alternatives
Currency
AUM Leader
Dimensional
Dimensional
JPMorgan
First Trust
Invesco
ETC
First Trust
ProShares
AUM Leader $B
$20.1
$48.2
$29.4
$16.0
$6.1
$1.5
$1.1
$0.5
Q1 CF Leader
Dimensional
JPMorgan
JPMorgan
Dimensional
Invesco
Mohr
iMGP
ProShares
Q1 CF Leader $B
$11.5
$13.7
$5.4
$2.5
$1.8
$0.2
$1.0
$0.2
Source: Factset as of 12/31/2022
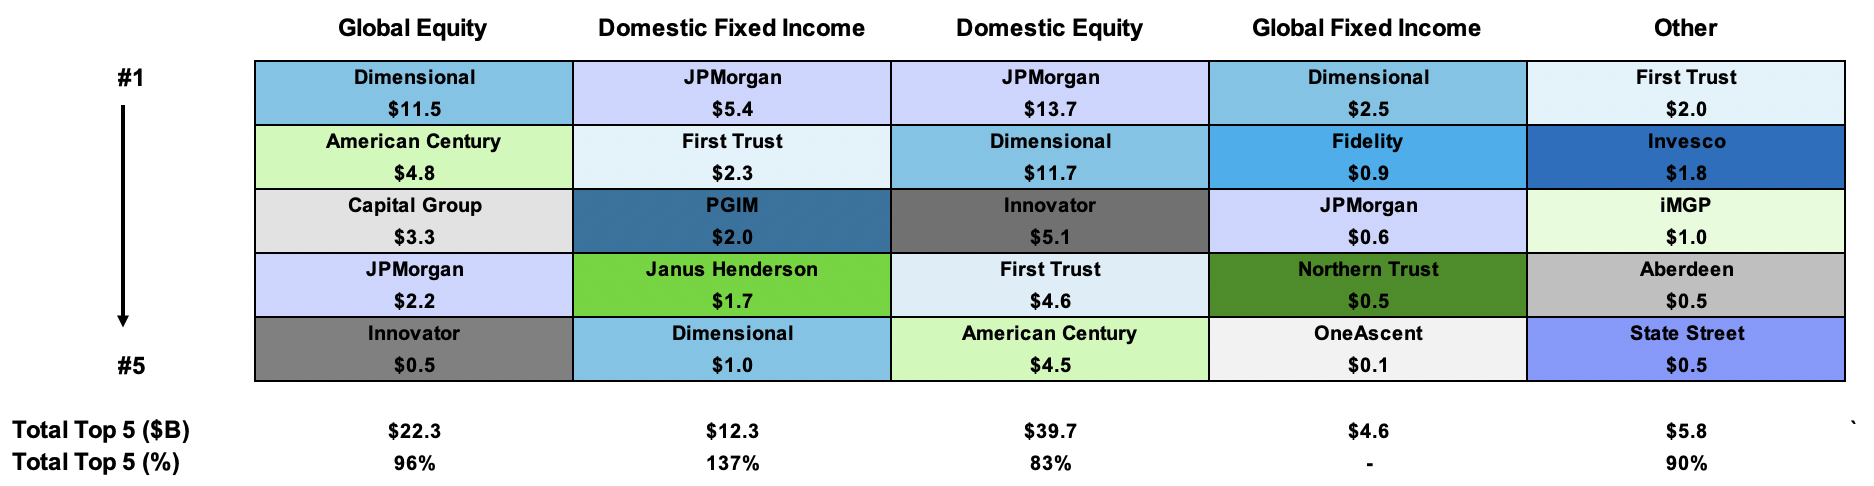
At the issuer level, Dimensional and JPMorgan positioned themselves as the 2022 cash flow leaders, taking in $26.6 billion and $21.9 billion, respectively. The two firms demonstrated leadership in different ways, as Dimensional had 13 of their 30 ETFs surpassing $1 billion in flows while JPMorgan had the two biggest cash flow winners of the year: JEPI (+$13.0 billion) and JPST (+$5.6 billion). American Century/Avantis (+$10.0 billion), First Trust (+$7.3 billion), Capital Group (+$5.9 billion), and Innovator (+$5.6 billion) rounded out the list of issuers with greater than $5 billion in cash flows for their actively managed lineups. First Trust and Innovator’s flows were heavily driven by their defined outcome strategies. American Century/Avantis and Capital Group both saw flows across their lineups into their broader market, lower cost actively managed ETFs.
2022 Cash Flow Leaders by Asset Class
Flows by Top 5
Source: Factset as of 12/31/2022
Despite volatile markets in 2022, over 77% of issuers experienced positive cash flows for the year and over a third had cash flows in excess of $50 million. In addition to the six issuers mentioned above, PGIM (+$2.0 billion), Amplify (+$1.6 billion), Janus Henderson (+$1.5 billion), Invesco (+$1.2 billion), and Fidelity (+$1.1 billion) all crossed $1 billion in net cash flows. These five issuers found varied paths to their success, from ultra-short fixed income (PGIM), dividend income (Amplify), AAA-rated CLOs (Janus Henderson), and commodities (Invesco) to broader fixed income (Fidelity). Led by the aforementioned Capital Group, an impressive nine new entrants to the ETF market crossed over $100 million in cash flow for the year. Issuers who entered the active ETF market in 2021 saw similar success in their first full year, with almost 80% of these issuers experiencing positive cash flows for 2022.
Ticker
Top 10 ETFs by Cash Flow ($B)
2022 ($M)
JEPI
JPMorgan Equity Premium Income ETF
$12,983
JPST
JPMorgan Ultra-Short Income ETF
$5,558
DFAC
Dimensional U.S. Core Equity 2 ETF
$3,639
FTSM
First Trust Enhanced Short Maturity ETF
$3,574
AVUV
Avantis U.S. Small Cap Value ETF
$2,665
DFIC
Dimensional International Core Equity 2 ETF
$2,085
DFCF
Dimensional Core Fixed Income ETF
$2,019
PULS
PGIM Ultra Short Bond ETF
$1,918
DFAI
Dimensional International Core Equity Market ETF
$1,849
PDBC
Invesco Optimum Yield Diversified Commodity Strategy No K-1 ETF
iShares U.S. ETF Trust iShares GSCI Commodity Dynamic Roll Strategy ETF
$(844)
IGBH
iShares Interest Rate Hedged Long-Term Corporate Bond ETF
$(677)
KRBN
KraneShares Global Carbon ETF
$(665)
At the product level, over 67% of active ETFs saw positive flows for the year and 233 experienced flows over $50 million (often viewed as a break-even measure for an ETF). As mentioned in our mid-year note, the industry’s asset weighted expense ratio dropped from 0.52% to 0.44% through the year, driven primarily by the impressive cash flow of lower fee ETFs such as JPST (0.18%) and JEPI (0.35%). Nearly 80% of all cash flows went into ETFs with expense ratios below the 44 bps industry average. In spite of this, roughly 72% of newly launched ETFs exceeded this industry average in 2022, though these funds only saw 25% of all fund flows to newly launched ETFs.
Expense Ratio
12/31/22 AUM
2022 CF
% AUM
% CF
# ETFs
0-25
$129,119,498,632
$36,731,321,205
38%
43%
99
26-50
$98,042,605,230
$32,437,790,020
29%
38%
216
51-75
$57,532,017,673
$2,480,783,745
17%
3%
264
76+
$57,136,286,208
$14,000,584,599
17%
16%
382
Expense Ratio
12/31/22 AUM
2021 CF
% AUM
% CF
# ETFs
0-25
$87,189,444,847
$19,242,732,049
30%
16%
71
26-50
$72,611,193,035
$20,904,115,920
25%
23%
157
51-75
$79,966,872,501
$31,816,809,580
24%
34%
189
76+
$52,245,286,420
$20,309,766,176
18%
22%
298
Source: Factset as of 12/31/2022
Bold Predictions for 2023
As the ETF industry enters its 30th year and the active market enters its 16th year, we have five more bold predictions for what 2023 will bring.
Assets under management (AUM): Grow from $340 billion to exceed $450 billion by year end 2023
Full-year cash flow: Make it three years in a row with over $80 billion
Mutual fund to ETF conversions: 15+ issuers will complete mutual fund to ETF conversions totaling over $20 billion
Active semi-transparent: 10+ ETFs will launch, and assets will exceed $7.5 billion
Growth milestone: At least two issuers will eclipse $75 billion in AUM
2022 Launch Monitor
Domestic Equity
99 ETFs Launched
$18.5 B Assets Raised
Domestic Fixed Income
28 ETFs Launched
$2.6 B Assets Raised
Alternatives
9 ETFs Launched
$451 M Assets Raised
Int'l/Global Equity
68 ETFs Launched
$15.8 B Assets Raised
Int'l/Global Fixed Income
20 ETFs Launched
$773 M Assets Raised
Asset Allocation
13 ETFs Launched
$278 M Assets Raised
Active ETF Stat Pack
Firms
# of Issuers
193
# of New Issuers 2022
47
Products
Assets
# of ETFs
961
AUM ($B)
$341.83
# of New Launches 2022
246
3 Yr AUM CAGR
52%
Avg. ER
0.44%
5 Yr AUM CAGR
52%
Cash Flow
Trading
YTD Cash Flow ($B)
$85.45
YTD ADV (Shares)
133,915,576
3 Yr Cash Flow
$235.65
YTD ADV ($)
$5.23 B
5 Yr Cash Flow
$2292.34
YTD Avg. Spread (bps)*
32.85
Source: Factset & NYSE Internal Database and Consolidated Tape Statistics as of 12/31/2022
*Simple average
Active, Semi-Transparent ETFs
Ticker
Inception
Name
AUM
YTD Flows
30 Day Median Spread (bps)
ADV (shares)
Structure
LMM
Expense Ratio
EQOP
9/17/20
Natixis U.S. Equity Opportunities ETF
$8,125,474
$613,143
13.04
828
NYSE AMS
Citadel
0.85%
VNSE
9/17/20
Natixis Vaughan Nelson Select ETF
$11,915,702
$8,247,761
12.02
1,974
NYSE AMS
Citadel
0.80%
VNMC
9/17/20
Natixis Vaughan Nelson Mid Cap ETF
$7,123,780
$(576,696)
14.195
612
NYSE AMS
Citadel
0.85%
ESGA
7/15/20
American Century Sustainable Equity ETF
$108,711,450
$(25,415,394)
12.37
10,989
NYSE AMS
Citadel
0.39%
MID
7/15/20
American Century Mid Cap Growth Impact ETF
$28,098,630
$9,964,870
10.875
4,722
NYSE AMS
Citadel
0.45%
ESGY
7/1/21
American Century Sustainable Growth ETF
$6,108,557
$1,144,328
7.55
334
NYSE AMS
Citadel
0.39%
NDVG
8/5/21
Nuveen Dividend Growth ETF
$7,680,529
$1,704,247
8.51
3,634
NYSE AMS
Citadel
0.64%
NSCS
8/5/21
Nuveen Small Cap Select ETF
$5,462,678
$24,166
11.27
394
NYSE AMS
Citadel
0.85%
NWLG
8/5/21
Nuveen Winslow Large-Cap Growth ESG ETF
$4,372,272
$33,409
8.96
4,910
NYSE AMS
Citadel
0.64%
NUGO
9/28/21
Nuveen Growth Opportunities ETF
$2,074,650,760
$(153,037,682)
9.065
290,617
NYSE AMS
Citadel
0.55%
SAEF
11/16/21
Schwab Ariel ESG ETF
$12,880,650
$7,175,250
42.71
3,516
NYSE AMS
Flow Traders
0.59%
IWLG
6/23/22
IQ Winslow Large Cap Growth ETF
$13,029,480
$8,176,090
23.36
5,500
NYSE AMS
Citadel
0.60%
IWFG
6/23/22
IQ Winslow Focused Large Cap Growth ETF
$5,521,110
$795,510
22.645
2,509
NYSE AMS
Citadel
0.65%
TSME
10/5/22
Thrivent Small-Mid Cap ESG ETF
$73,483,105
$70,415,460
9.955
52,770
NYSE AMS
RBC
0.65%
FDG
4/2/20
American Century Focused Dynamic Growth ETF
$123,280,828
$(13,253,821)
11.965
22,080
ActiveShares
Citadel
0.45%
FLV
4/2/20
American Century Focused Large Cap Value ETF
$222,088,160
$(7,596,253)
10.31
9,318
ActiveShares
Citadel
0.42%
FBCG
6/4/20
Fidelity Blue Chip Growth ETF
$385,942,736
$79,932,858
21.285
135,185
Fidelity Proxy
GTS
0.59%
FBCV
6/4/20
Fidelity Blue Chip Value ETF
$137,909,486
$39,522,443
27.555
27,618
Fidelity Proxy
GTS
0.59%
FMIL
6/4/20
Fidelity New Millennium ETF
$83,044,144
$20,200,759
34.38
14,538
Fidelity Proxy
GTS
0.59%
FGRO
2/4/21
Fidelity Growth Opportunities ETF
$54,863,533
$22,960,461
14.505
152,222
Fidelity Proxy
Citadel
0.59%
FMAG
2/4/21
Fidelity Magellan ETF
$41,305,383
$241,853
12.415
14,841
Fidelity Proxy
RBC
0.59%
FPRO
2/4/21
Fidelity Real Estate Investment ETF
$16,243,389
$(804,779)
11.04
5,487
Fidelity Proxy
Citadel
0.59%
FSMO
2/4/21
Fidelity Small/Mid-Cap Opportunities ETF
$27,948,438
$1,021,122
9.115
6,984
Fidelity Proxy
RBC
0.59%
FSST
6/17/21
Fidelity Sustainability U.S. Equity ETF
$7,269,893
$2,335,523
12.6
1,409
Fidelity Proxy
RBC
0.59%
FDWM
6/17/21
Fidelity Women's Leadership ETF
$3,380,055
$1,686,895
13.97
898
Fidelity Proxy
RBC
0.59%
TCHP
8/5/20
T. Rowe Price Blue Chip Growth ETF
$260,337,796
$113,332,745
11.375
129,435
T Rowe Proxy
Virtu
0.57%
TDVG
8/5/20
T. Rowe Price Dividend Growth ETF
$273,369,165
$160,605,821
9.995
42,969
T Rowe Proxy
RBC
0.50%
TEQI
8/5/20
T. Rowe Price Equity Income ETF
$99,308,477
$47,122,299
8.8
19,193
T Rowe Proxy
Virtu
0.54%
TGRW
8/5/20
T. Rowe Price Growth Stock ETF
$34,733,694
$5,925,824
11.6
13,409
T Rowe Proxy
RBC
0.52%
TSPA
6/8/21
T. Rowe Price U.S. Equity Research ETF
$23,125,985
$4,832,218
10.945
2,716
T Rowe Proxy
RBC
0.52%
IVDG
12/22/20
Invesco Focused Discovery Growth ETF
$693,080
$(207,050)
10.77
317
Invesco Model
Citadel
0.59%
IVSG
12/22/20
Invesco Select Growth ETF
$839,889
$(95,330)
10.825
332
Invesco Model
Citadel
0.48%
IVLC
12/22/20
Invesco US Large Cap Core ESG ETF
$5,632,022
$(24,960)
16.375
1,352
Fidelity Proxy
Citadel
0.48%
IVRA
12/22/20
Invesco Real Assets ESG ETF
$3,083,163
$1,085,240
33.72
1,444
Fidelity Proxy
Citadel
0.59%
LOPP
2/1/21
Gabelli Love Our Planet & People ETF
$12,602,100
$3,319,190
77.85
592
ActiveShares
GTS
0.90%
GGRW
2/16/21
Gabelli Growth Innovators ETF
$2,084,600
$(252,075)
26.495
432
ActiveShares
GTS
0.90%
GAST
1/5/22
Gabelli Asset ETF
$4,391,310
$244,380
47.455
100
ActiveShares
GTS
0.90%
GABF
5/11/22
Gabelli Financial Services Opportunities ETF
$5,223,960
$261,400
75.295
239
ActiveShares
GTS
0.00%
FRTY
3/1/21
Alger Mid Cap 40 ETF
$28,616,000
$6,703,375
42.25
19,565
ActiveShares
Virtu
0.60%
ATFV
5/4/21
Alger 35 ETF
$8,992,500
$268,250
41.86
1,438
ActiveShares
Virtu
0.55%
REIT
2/26/21
ALPS Active REIT ETF
$17,131,448
$(4,502,900)
26.965
4,835
Blue Tractor
GTS
0.68%
STNC
3/16/21
Hennessy Stance ESG Large Cap ETF
$42,150,132
$-
28.965
2,711
Blue Tractor
GTS
0.85%
PFUT
5/26/21
Putnam Sustainable Future ETF
$7,160,040
$1,347,571
33.47
1,772
Fidelity Proxy
Virtu
0.64%
PLDR
5/26/21
Putnam Sustainable Leaders ETF
$5,906,321
$(6,316)
10.875
345
Fidelity Proxy
RBC
0.59%
PGRO
5/26/21
Putnam Focused Large Cap Growth ETF
$9,527,127
$2,783,478
10.34
1,951
Fidelity Proxy
RBC
0.55%
PVAL
5/26/21
Putnam Focused Large Cap Value ETF
$136,565,286
$114,138,296
30.365
25,588
Fidelity Proxy
Virtu
0.55%
HFGO
11/9/21
Hartford Large Cap Growth ETF
$72,298,888
$79,387,269
29.42
102,966
Fidelity Proxy
Citadel
0.59%
SEMI
3/30/22
Columbia Seligman Semiconductor and Technology ETF
$13,993,977
$10,711,950
36.585
8,261
Fidelity Proxy
Virtu
0.75%
CAPE
4/5/22
DoubleLine Shiller CAPE U.S. Equities ETF
$207,174,100
$216,526,800
14.06
98,909
ActiveShares
Citadel
0.65%
FMCX
4/25/22
FMC Excelsior Focus Equity ETF
$69,946,350
$2,198,100
48.075
1,121
ActiveShares
GTS
0.70%
BYRE
5/19/22
Principal Real Estate Active Opportunities ETF
$4,962,849
$5,497,348
25.83
1,470
Fidelity Proxy
Virtu
0.65%
Total/Average
$4,820,290,481
$846,714,446
21.89
1,257,353
0.61%
Source: Factset & NYSE Internal Database and Consolidated Tape Statistics as of 12/31/2022
*Simple average
December ETF Launches
Ticker
Name
Issuer
Launch Date
Asset Class
AUM
DECT
AllianzIM U.S. Large Cap Buffer10 Dec ETF
Allianz
12/1/22
Equity
$18,008,850
DECW
AllianzIM U.S. Large Cap Buffer20 Dec ETF
Allianz
12/1/22
Equity
$83,654,940
INTL
Main International ETF
Main Management
12/2/22
Equity
$55,970,200
SECD
Senior Secured Credit Opportunities ETF
Toroso Investments
12/6/22
Fixed Income
$496,798
QVOY
Q3 All-Season Active Rotation ETF
Q3 Asset Management Corp.
12/7/22
Asset Allocation
$49,760,000
DFLV
Dimensional US Large Cap Value ETF
Dimensional Holdings
12/7/22
Equity
$179,977,980
DFGR
Dimensional Global Real Estate ETF
Dimensional Holdings
12/7/22
Equity
$204,524,065
HIYS
Invesco High Yield Select ETF
Invesco
12/9/22
Fixed Income
$9,840,825
ICLO
Invesco AAA CLO Floating Rate Note ETF
Invesco
12/9/22
Fixed Income
$30,183,625
IMSI
Invesco Municipal Strategic Income ETF
Invesco
12/9/22
Fixed Income
$29,847,650
ISDB
Invesco Short Duration Bond ETF
Invesco
12/9/22
Fixed Income
$9,998,425
RNWZ
TrueShares Eagle Global Renewable Energy Income ETF
TrueMark Group
12/9/22
Equity
$2,473,390
BABX
GraniteShares 1.75x Long BABA Daily ETF
GraniteShares
12/13/22
Equity
$737,725
FBL
GraniteShares 1.5x Long Meta Daily ETF
GraniteShares
12/13/22
Equity
$797,727
NVDL
GraniteShares 1.5x Long NVDA Daily ETF
GraniteShares
12/13/22
Equity
$563,419
DIP
BTD Capital Fund
Exchange Traded Concepts
12/13/22
Equity
$1,699,600
VEMY
Virtus Stone Harbor Emerging Markets High Yield Bond ETF
Virtus Investment Partners
12/13/22
Fixed Income
$3,735,850
PBL
PGIM Portfolio Ballast ETF
PGIM
12/14/22
Asset Allocation
$24,866,580
PJFG
PGIM Jennison Focused Growth ETF
PGIM
12/14/22
Equity
$9,870,000
PJFV
PGIM Jennison Focused Value ETF
PGIM
12/14/22
Equity
$10,292,310
INFR
ClearBridge Sustainable Infrastructure ETF
Franklin Templeton
12/16/22
Equity
$2,432,000
JHID
John Hancock International High Dividend ETF
John Hancock
12/21/22
Equity
$5,007,460
PIT
VanEck Commodity Strategy ETF
VanEck
12/22/22
Commodities
$20,132,000
KCAL
Subversive Food Security ETF
Subversive
12/22/22
Equity
$615,285
DKRB
Subversive Decarbonization ETF
Subversive
12/22/22
Equity
$623,943
ARP
PMV Adaptive Risk Parity ETF
PMV Capital Advisers LLC
12/22/22
Alternatives
$28,003,085
SANE
Subversive Mental Health ETF
Subversive
12/23/22
Equity
$621,848
BOXX
Alpha Architect 1-3 Month Box ETF
Alpha Architect
12/28/22
Fixed Income
$17,003,383
CHRG
Element EV, Solar & Battery Materials (Lithium, Nickel, Copper, Cobalt) Futures Strategy ETF
Element ETFs LLC
12/29/22
Commodities
$5,000,000
FCUS
Pinnacle Focused Opportunities ETF
Toroso Investments
12/30/22
Equity
$500,000
Total - 30 New ETFs
$807,238,960
Source: Factset & NYSE Internal Database and Consolidated Tape Statistics as of 12/31/2022
Missed our Active ETF Webinar series or latest podcast series? Visit the redesigned HomeofETFs.com to catch up.
Hear from ETF experts including active ETF structure providers, fund sponsors (American Century, Alger, Fidelity, PIMCO and T. Rowe Price), liquidity providers (Flow Traders and Jane Street), and service providers (BBH, BNY Mellon and State Street).