Review of 2022 Through the Third Quarter
Market turbulence alongside ETF growth
Published
October 18, 2022
At the beginning of this year, the New York Stock Exchange made five bold predictions for the active ETF market in 2022:
- Assets under management (AUM): Grow from $293.1 billion at the start of the year to exceed $425 billion by year-end 2022
- Full year cash flow: Another new record with over $80 billion
- Mutual fund to ETF conversions: 10+ issuers will complete Mutual Fund to ETF conversions totaling over $20 billion
- Active semi-transparent: 20+ ETFs will launch, and assets will exceed $10 billion
- Growth milestone: At least one issuer will eclipse $60 billon in AUM
So where are we after three quarters of 2022?
- Assets have grown to $305.6 billion despite market conditions, but it looks like this prediction will fall short.
- Year-to-date cash flows currently exceed $59.1 billion, so this prediction will likely come down to the final trading days of the calendar year. With investors looking to harvest some taxable losses, we remain optimistic that this rebalance activity will result in flows to actively managed funds, hitting our prediction for the year.
- The industry welcomed eight active ETFs from five separate issuers via conversion from mutual funds with combined assets on conversion of $16.5 billion. A few additional issuers have publicly announced conversion plans, but this prediction looks like it may fall just short.
- Eight new active semi-transparent ETFs came to market in the first three quarters and total assets stand at $4.37 billion. The current investable asset class limitation to U.S. equity is a real headwind. There are filings on the horizon, but we likely need to see investable asset class expansion.
- Dimensional ended the quarter with $56.3 billion in assets and is on pace to exceed $60 billion with its current cash flows. JP Morgan ended the quarter at $49.4 billion in actively managed assets and has an outside chance to crack $60 billion at its current pace.
Beyond our bold predictions, there are three additional stats from the first three quarters of the year that stood out to us:
- Firms with postive cash flow: 142 firms, or roughly 77% of firms
- ETFs with postive cash flow: 639 active ETFs, or nearly 71% of all products
- Over 55% of all ETF launches this year have been actively managed, slightly down from just over 60% in 2021
Quarterly Active ETF Cash Flows
Despite bearish market conditions, actively managed ETFs continue to see growth across all asset classes three quarters into 2022. Equity inflows continued to dominate headlines, accounting for over $47.6 billion of the total $56.3 billion taken in by the total active market. Domestic equity also lead the charge, accounting for just under two thirds of the equity inflows, with notable flows into both large cap and value funds. Domestic fixed income dominated global fixed income $5.8 billion vs. -$1.4 billion, as global fixed income was the only segment to see net outflows year-to-date. Ultra-short term comprised most of these domestic fixed income flows. Commodity flows, $4.1 billion, continued to cool after a record setting first quarter as many investors instead looked to alternatives to mitigate the impact of inflation and rising rates. Alternatives continued their record setting year with over $2.4 billion in inflows, causing the asset class to more than double year-to-date.
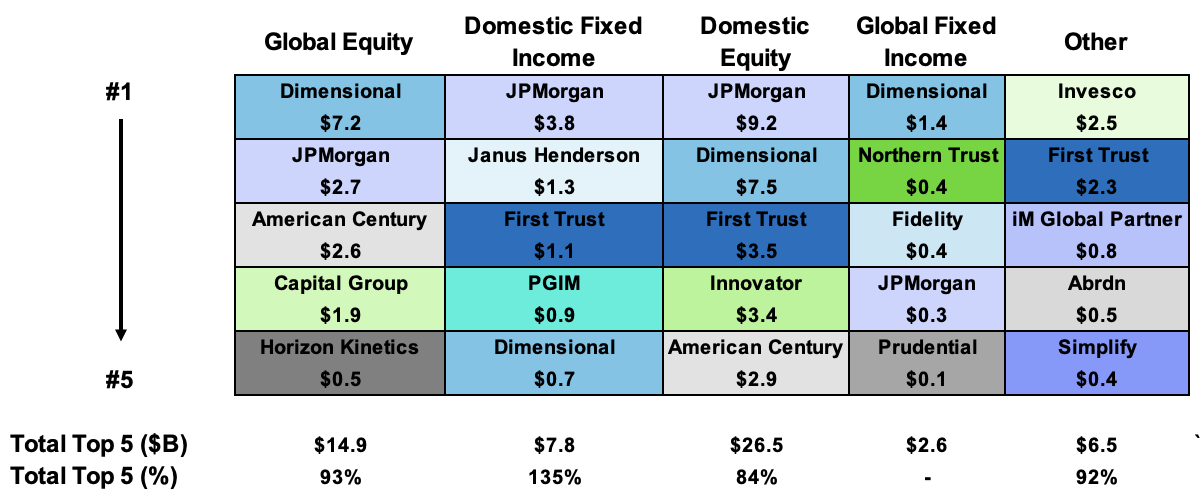
Active ETF Flows By Asset Class
| Global Equity | Domestic Equity | Domestic Fixed Income | Global Fixed Income | Commodities | Asset Allocation | Alternatives | Currency |
|---|
| AUM Leader | Dimensional | Dimensional | JPMorgan | First Trust | Invesco | ETC | First Trust | ProShares |
| AUM Leader $B | $13.6 | $39.9 | $27.9 | $16.5 | $7.4 | $1.7 | $1.0 | $0.6 |
| YTD CF Leader | Dimensional | JPMorgan | JPMorgan | Dimensional | Invesco | STF | iM Global Partner | ProShares |
| YTD CF Leader $B | $7.2 | $9.2 | $3.8 | $1.4 | $2.5 | $0.2 | $0.8 | $0.2 |
Source: Factset as of 9/30/2022
At the issuer level, Dimensional ($16.8 billion) narrowly surpassed JP Morgan ($16.0 billion) for the year-to-date cash flow crown. Investor interest remained strong in its suite of eight Core ETFs ($9.9 billion). Notably, all 24 of Dimensional’s ETFs have experienced inflows with its non-Core ETFs gathering nearly $7.0 billion, led by US High Profitability ETF (NYSE listed: DUHP). Right behind them, JP Morgan was led by the combination of strong flows into its Equity Premium Income ETF (NYSE listed: JEPI, $8.9 billion) and recent transfer to the NYSE Ultra Short Income ETF (NYSE listed: JPST, $3.8 billion). Rounding out the top five were First Trust ($6.0 billion), American Century ($5.9 billion) and Innovator ($3.6 billion). Collectively, the top five issuers by assets accounted for 60% of cash flow - a 10% reversal to the upside from last quarter and back in line with 2021 year-end totals.
% Flows Going to Top 5 Issuers
Across the industry, year-to-date positive flows by issuer remained unchanged at approximately 75% and nearly 23% saw inflows exceeding $100 million. Just outside of the top five, Capital Group ($3.4 billion- 2022 market entrant), Invesco ($1.8 billion-experienced Q3 outflows), Janus Henderson ($1.4 billion), and Amplify ($1.1 billion) all surpassed the $1 billion cash flow mark. Other notables included PGIM ($0.9 billion, led by Ultra Short ETF, NYSE listed: PULS), iM Global Partners ($0.8 billion, nearly $0.6 billion in Q3 alone across their two ETFs led by their Managed Futures ETF, NYSE listed: DBMF), Simplify ($0.6 billion, led by their suite of alternative ETFs that manage risk), and Goldman Sachs ($0.49 billion, 2.2x 2021 full year flows).
YTD Q3 2022 Cash Flow Leaders By Asset Class
Source: Factset as of 9/30/2022
At the product level, year-to-date positive flows stayed flat at nearly 65% of all active ETFs and 192 (over 20%) experienced flows more than $50 million (often viewed as a break-even measure for an ETF). Within the Top 10 ETFs by year-to-date flow, it’s worth noting the reappearance of Ark’s Innovation ETF (NYSE listed: ARKK). Despite performance headwinds (down 61% year-to-date), the ETF has continued to see investor interest, gathering $1.5 billion.
| Ticker | Top 10 ETFs by Cash Flow ($B) | YTD Q3 2022 ($M) |
|---|
| JEPI | JPMorgan Equity Premium Income ETF | $8.9 |
| JPST | JPMorgan Ultra-Short Income ETF | $3.8 |
| PDBC | Invesco Optimum Yield Diversified Commodity Strategy No K-1 ETF | $2.5 |
| DFAC | Dimensional U.S. Core Equity 2 ETF | $2.4 |
| FTSM | First Trust Enhanced Short Maturity ETF | $2.1 |
| FTGC | First Trust Global Tactical Commodity Strategy Fund | $2.0 |
| AVUV | Avantis U.S. Small Cap Value ETF | $1.7 |
| JIRE | JPMorgan International Research Enhanced Equity ETF | $1.7 |
| ARKK | ARK Innovation ETF | $1.5 |
| DFAI | Dimensional International Core Equity Market ETF | $1.3 |
| Ticker | Bottom 10 ETFs by Cash Flow ($B) | YTD Q3 2022 ($M) |
|---|
| MINT | PIMCO Enhanced Short Maturity Active ETF | $(2.3) |
| SRLN | SPDR Blackstone Senior Loan ETF | $(1.2) |
| FIXD | First Trust TCW Opportunistic Fixed Income ETF | $(1.0) |
| IVOL | Quadratic Interest Rate Volatility & Inflation Hedge ETF | $(1.0) |
| JPHY | JPMORGAN HIGH YIELD RESEARCH ENHANCED ETF | $(1.0) |
| LMBS | First Trust Low Duration Opportunities ETF | $(0.9) |
| COMT | iShares U.S. ETF Trust iShares GSCI Commodity Dynamic Roll Strategy ETF | $(0.8) |
| IGBH | iShares Interest Rate Hedged Long-Term Corporate Bond ETF | $(0.7) |
| BOND | PIMCO Active Bond ETF | $(0.6) |
| GSY | Invesco Ultra Short Duration ETF | $(0.6) |
Source: Factset as of 9/30/2022
Last quarter we noted that the industry’s asset weighted expense ratio had ticked down from 0.52% to 0.42% and we’d be monitoring it going forward. This quarter, it ticked back up to 0.45%. A deeper dive reveals that ETFs priced at or below 0.50% secured 67% of the flows through quarter three, over their asset under management share of 57%. When we completed a similar analysis in 2021 (shown below), 39% of cash flow was secured by these ETFs and their share stood at 48%. Despite this reversal, new active ETF pricing continues to favor prices north of 0.50%, as evidenced by nearly 70% of ETFs launched this year falling into this bucket. More to come on this trend.
| Expense Ratio | 9/30/22 AUM | 2022 CF | % AUM | % CF | # ETFs |
|---|
| 0-25 | $91,314,731,892 | $18,804,688,342 | 30% | 32% | 76 |
| 26-50 | $81,710,267,288 | $20,644,254,332 | 27% | 35% | 200 |
| 51-75 | $59,687,267,304 | $3,163,404,030 | 20% | 5% | 242 |
| 76+ | $52,794,614,323 | $10,932,180,866 | 17% | 18% | 364 |
| Expense Ratio | 9/30/22 AUM | 2022 CF | % AUM | % CF | # ETFs |
|---|
| 0-25 | $66,482,510,621 | $13,346,873,042 | 24% | 19% | 56 |
| 26-50 | $66,701,709,768 | $14,347,355,197 | 24% | 20% | 146 |
| 51-75 | $81,442,401,051 | $26,539,563,878 | 30% | 38% | 163 |
| 76+ | $46,820,527,844 | $15,495,589,568 | 17% | 22% | 266 |
Source: Factset as of 9/30/2022
As the industry enters the final quarter of the year, we will be keeping a watchful eye on the evolving active ETF market and how our five 2022 predictions play out by year’s end.
Launch Monitor Through Quarter Three
75 ETFs Launched
$12.9 B Assets Raised
13 ETFs Launched
$1.7 B Assets Raised
6 ETFs Launched
$180 M Assets Raised
48 ETFs Launched
$9.8 B Assets Raised
Int'l/Global Fixed Income
13 ETFs Launched
$548 M Assets Raised
9 ETFs Launched
$212 M Assets Raised
Source: FactSet as of 9/30/2022, figures include MF-ETF conversions
Active ETF Stat Pack
| Firms | | | |
|---|
| # of Issuers | 183 | | |
| # of New Issuers 2022 | 36 | | |
| Products | | Assets | |
|---|
| # of ETFs | 901 | AUM ($B) | $305.55 |
| # of New Launches 2022 | 170 | 3 Yr AUM CAGR | 51% |
| Avg. ER | 0.45% | 5 Yr AUM CAGR | 51% |
| Cash Flow | | Trading | |
|---|
| YTD Cash Flow ($B) | $59.10 | YTD ADV (Shares) | 124,804,654 |
| 3 Yr Cash Flow | $217.90 | YTD ADV ($) | $4.94 B |
| 5 Yr Cash Flow | $270.60 | YTD Avg. Spread (bps)* | 32.85 |
Source: Factset & NYSE Internal Database and Consolidated Tape Statistics as of 9/30/2022
*Simple average
Active, Semi-Transparent Update
| Ticker | Inception | Name | AUM | YTD Cash Flow | 30-Day Med. Spread (bps) | ADV (shares) | Structure | LMM | Expense Ratio |
|---|
| EQOP | 09/17/2020 | Natixis U.S. Equity Opportunities ETF | $8,562,663 | $1,421,079 | 12.92 | 866 | NYSE AMS | Citadel | 0.85% |
| VNSE | 09/17/2020 | Natixis Vaughan Nelson Select ETF | $9,362,456 | $6,209,800 | 11.485 | 1,917 | NYSE AMS | Citadel | 0.80% |
| VNMC | 09/17/2020 | Natixis Vaughan Nelson Mid Cap ETF | $7,067,769 | $602 | 13.835 | 592 | NYSE AMS | Citadel | 0.85% |
| ESGA | 07/15/2020 | American Century Sustainable Equity ETF | $95,671,080 | $(30,976,312) | 10.91 | 12,694 | NYSE AMS | Citadel | 0.39% |
| MID | 07/15/2020 | American Century Mid Cap Growth Impact ETF | $23,204,010 | $5,618,626 | 9.84 | 4,508 | NYSE AMS | Citadel | 0.45% |
| ESGY | 07/01/2021 | American Century Sustainable Growth ETF | $5,987,033 | $1,144,328 | 5.92 | 387 | NYSE AMS | Citadel | 0.39% |
| NDVG | 08/05/2021 | Nuveen Dividend Growth ETF | $6,941,055 | $1,688,823 | 7.65 | 3,581 | NYSE AMS | Citadel | 0.64% |
| NSCS | 08/05/2021 | Nuveen Small Cap Select ETF | $4,906,400 | $(184,810) | 9.905 | 472 | NYSE AMS | Citadel | 0.85% |
| NWLG | 08/05/2021 | Nuveen Winslow Large-Cap Growth ESG ETF | $4,263,325 | $210,141 | 8.11 | 4,397 | NYSE AMS | Citadel | 0.64% |
| NUGO | 09/28/2021 | Nuveen Growth Opportunities ETF | $2,183,753,754 | $(10,483,170) | 7.11 | 208,352 | NYSE AMS | Citadel | 0.55% |
| SAEF | 11/16/2021 | Schwab Ariel ESG ETF | $10,846,850 | $6,138,700 | 35.38 | 3,647 | NYSE AMS | Flow Traders | 0.59% |
| IWLG | 06/23/2022 | IQ Winslow Large Cap Growth ETF | $12,299,670 | $8,138,670 | 23.02 | 9,408 | NYSE AMS | Citadel | 0.60% |
| IWFG | 06/23/2022 | IQ Winslow Focused Large Cap Growth ETF | $5,291,220 | $1,036,600 | 23.145 | 4,275 | NYSE AMS | Citadel | 0.65% |
| FDG | 04/02/2020 | American Century Focused Dynamic Growth ETF | $124,088,216 | $(15,707,742) | 9.945 | 25,551 | ActiveShares | Citadel | 0.45% |
| FLV | 04/02/2020 | American Century Focused Large Cap Value ETF | $202,655,250 | $(6,101,754) | 10.44 | 8,244 | ActiveShares | Citadel | 0.42% |
| FBCG | 06/04/2020 | Fidelity Blue Chip Growth ETF | $330,686,929 | $11,550,854 | 24.63 | 128,929 | Fidelity Proxy | GTS | 0.59% |
| FBCV | 06/04/2020 | Fidelity Blue Chip Value ETF | $105,437,116 | $17,227,723 | 27.65 | 26,573 | Fidelity Proxy | GTS | 0.59% |
| FMIL | 06/04/2020 | Fidelity New Millennium ETF | $60,240,956 | $5,870,668 | 30.995 | 12,345 | Fidelity Proxy | GTS | 0.59% |
| FGRO | 02/04/2021 | Fidelity Growth Opportunities ETF | $63,484,619 | $31,593,804 | 13.015 | 158,691 | Fidelity Proxy | Citadel | 0.59% |
| FMAG | 02/04/2021 | Fidelity Magellan ETF | $40,523,706 | $1,216,689 | 12.24 | 16,256 | Fidelity Proxy | RBC | 0.59% |
| FPRO | 02/04/2021 | Fidelity Real Estate Investment ETF | $15,882,485 | $(314,917) | 8.91 | 5,834 | Fidelity Proxy | Citadel | 0.59% |
| FSMO | 02/04/2021 | Fidelity Small/Mid-Cap Opportunities ETF | $24,495,418 | $(27,513) | 12.08 | 7,185 | Fidelity Proxy | RBC | 0.59% |
| FSST | 06/17/2021 | Fidelity Sustainability U.S. Equity ETF | $5,867,811 | $1,428,953 | 10.475 | 1,336 | Fidelity Proxy | RBC | 0.59% |
| FDWM | 06/17/2021 | Fidelity Women's Leadership ETF | $2,322,819 | $235 | 11.795 | 559 | Fidelity Proxy | RBC | 0.59% |
| TCHP | 08/05/2020 | T. Rowe Price Blue Chip Growth ETF | $237,703,544 | $82,062,947 | 11.56 | 122,129 | T Rowe Proxy | Virtu | 0.57% |
| TDVG | 08/05/2020 | T. Rowe Price Dividend Growth ETF | $155,107,461 | $58,562,975 | 10.525 | 27,274 | T Rowe Proxy | RBC | 0.50% |
| TEQI | 08/05/2020 | T. Rowe Price Equity Income ETF | $88,855,992 | $47,732,500 | 8.47 | 18,114 | T Rowe Proxy | Virtu | 0.54% |
| TGRW | 08/05/2020 | T. Rowe Price Growth Stock ETF | $36,063,955 | $6,155,412 | 11.21 | 14,648 | T Rowe Proxy | RBC | 0.52% |
| TSPA | 06/08/2021 | T. Rowe Price U.S. Equity Research ETF | $20,494,798 | $3,091,606 | 10.52 | 2,278 | T Rowe Proxy | RBC | 0.52% |
| IVDG | 12/22/2020 | Invesco Focused Discovery Growth ETF | $577,450 | $(310,730) | 10.53 | 337 | Invesco Model | Citadel | 0.59% |
| IVSG | 12/22/2020 | Invesco Select Growth ETF | $942,709 | $(1,820) | 10.075 | 339 | Invesco Model | Citadel | 0.48% |
| IVLC | 12/22/2020 | Invesco US Large Cap Core ESG ETF | $5,303,961 | $(24,960) | 16.235 | 1,647 | Fidelity Proxy | Citadel | 0.48% |
| IVRA | 12/22/2020 | Invesco Real Assets ESG ETF | $2,846,722 | $1,085,240 | 33.01 | 1,523 | Fidelity Proxy | Citadel | 0.59% |
| LOPP | 02/01/2021 | Gabelli Love Our Planet & People ETF | $11,767,230 | $3,319,190 | 40.575 | 757 | ActiveShares | GTS | 0.90% |
| GGRW | 02/16/2021 | Gabelli Growth Innovators ETF | $2,212,140 | $(252,075) | 72.61 | 484 | ActiveShares | GTS | 0.90% |
| GAST | 01/05/2022 | Gabelli Asset ETF | $4,050,690 | $244,380 | 48.705 | 131 | ActiveShares | GTS | 0.90% |
| FRTY | 03/01/2021 | Alger Mid Cap 40 ETF | $28,395,125 | $6,256,000 | 42.8 | 20,255 | ActiveShares | Virtu | 0.60% |
| ATFV | 05/04/2021 | Alger 35 ETF | $9,130,000 | $268,250 | 39 | 1,881 | ActiveShares | Virtu | 0.55% |
| REIT | 02/26/2021 | ALPS Active REIT ETF | $16,003,545 | $(4,738,000) | 46.24 | 5,294 | Blue Tractor | GTS | 0.68% |
| STNC | 03/16/2021 | Stance Equity ESG Large Cap Core ETF | $40,592,678 | $9,312,726 | 18.665 | 2,612 | Blue Tractor | GTS | 0.85% |
| PFUT | 05/26/2021 | Putnam Sustainable Future ETF | $6,649,486 | $927,053 | 35.47 | 2,180 | Fidelity Proxy | Virtu | 0.64% |
| PLDR | 05/26/2021 | Putnam Sustainable Leaders ETF | $5,656,557 | $6,663 | 13.765 | 339 | Fidelity Proxy | RBC | 0.59% |
| PGRO | 05/26/2021 | Putnam Focused Large Cap Growth ETF | $9,157,434 | $2,263,707 | 10.83 | 2,008 | Fidelity Proxy | RBC | 0.55% |
| PVAL | 05/26/2021 | Putnam Focused Large Cap Value ETF | $45,927,111 | $33,024,672 | 34.63 | 11,988 | Fidelity Proxy | Virtu | 0.55% |
| HFGO | 11/09/2021 | Hartford Large Cap Growth ETF | $70,300,060 | $79,114,169 | 29.4 | 133,310 | Fidelity Proxy | Citadel | 0.59% |
| SEMI | 03/30/2022 | Columbia Seligman Semiconductor and Technology ETF | $12,162,062 | $9,448,100 | 34.945 | 10,521 | Fidelity Proxy | Virtu | 0.75% |
| CAPE | 04/05/2022 | DoubleLine Shiller CAPE U.S. Equities ETF | $130,192,820 | $143,548,000 | 14.915 | 98,597 | ActiveShares | Citadel | 0.65% |
| FMCX | 04/25/2022 | FMC Excelsior Focus Equity ETF | $65,727,200 | $484,500 | 52.205 | 1,036 | ActiveShares | GTS | 0.70% |
| GABF | 05/11/2022 | Gabelli Financial Services Opportunities ETF | $4,873,050 | $261,400 | 35.82 | 281 | ActiveShares | GTS | 0.00% |
| BYRE | 05/19/2022 | Principal Real Estate Active Opportunities ETF | $4,808,738 | $5,497,348 | 17.11 | 2,168 | Fidelity Proxy | Virtu | 0.65% |
| | Total/Average | $4,369,345,129 | $524,039,333 | 21.37 | 1,128,731 | | | 0.60% |
|---|
Source: FactSet & NYSE Internal Database and Consolidated Tape Statistics as of 9/9/2022
*Simple average
September Active ETF Launches
| Ticker | Name | Issuer | Launch Date | Asset Class | AUM |
|---|
| OSEA | Harbor International Compounders ETF | Harbor | 09/08/2022 | Equity | $5,973,208 |
| IDVO | Amplify International Enhanced Dividend Income ETF | Amplify Investments | 09/08/2022 | Equity | $1,737,855 |
| EMCA | Emerge EMPWR Sustainable Dividend Equity ETF | Emerge Capital Management, Inc. | 09/08/2022 | Equity | $469,000 |
| EMCH | Emerge EMPWR Sustainable Emerging Markets Equity ETF | Emerge Capital Management, Inc. | 09/08/2022 | Equity | $469,000 |
| EMZA | Emerge EMPWR Sustainable Global Core Equity ETF | Emerge Capital Management, Inc. | 09/08/2022 | Equity | $465,000 |
| EMGC | Emerge EMPWR Sustainable Select Growth Equity ETF | Emerge Capital Management, Inc. | 09/09/2022 | Equity | $465,200 |
| EMPW | Emerge EMPWR Unified Sustainable Equity ETF | Emerge Capital Management, Inc. | 09/09/2022 | Equity | $494,045 |
| KARB | Carbon Strategy ETF | Exchange Traded Concepts | 09/13/2022 | Commodities | $270,048 |
| THLV | THOR Low Volatility ETF | Thor Trading Advisors LLC | 09/13/2022 | Equity | $9,607,840 |
| SDGS | Newday Sustainable Development Equity ETF | Toroso Investments | 09/13/2022 | Equity | $1,341,030 |
| YEAR | AB Ultra Short Income ETF | AllianceBernstein Holding | 09/14/2022 | Fixed Income | $149,506,819 |
| TAFI | AB Tax-Aware Short Duration Municipal ETF | AllianceBernstein Holding | 09/14/2022 | Fixed Income | $25,873,940 |
| OAIM | OneAscent International Equity ETF | Oneascent Holdings LLC | 09/15/2022 | Equity | $52,045,200 |
| CCSO | Carbon Collective Climate Solutions U.S. Equity ETF | Toroso Investments | 09/20/2022 | Equity | $5,367,000 |
| XSEP | FT Cboe Vest U.S. Equity Enhance & Moderate Buffer ETF - September | First Trust | 09/22/2022 | Equity | $39,703,559 |
| JHDV | John Hancock U.S. High Dividend ETF | John Hancock | 09/28/2022 | Equity | $4,883,640 |
| AVGE | Avantis All Equity Markets ETF | American Century Investments | 09/29/2022 | Equity | $1,373,842 |
| AVIE | Avantis Inflation Focused Equity ETF | American Century Investments | 09/29/2022 | Equity | $996,970 |
| NOPE | Noble Absolute Return ETF | Toroso Investments | 09/29/2022 | Equity | $503,048 |
| NXTE | AXS Green Alpha ETF | AXS Investments | 09/29/2022 | Equity | $25,588,440 |
| SYNB | Putnam BioRevolution ETF | Putnam | 09/30/2022 | Equity | $3,099,725 |
| DIVD | Altrius Global Dividend ETF | Alpha Architect | 09/30/2022 | Equity | $243,739 |
| MAXI | Simplify Bitcoin Strategy PLUS Income ETF | Simplify Asset Management Inc. | 09/30/2022 | Currency | $250,313 |
| Total - 23 New ETFs | | | | $330,728,460 |
|---|
Source: Factset as of 9/30/2022