Review of First Half 2022: Growth Despite Headwinds
At the beginning of this year, the New York Stock Exchange made five bold predictions for the active ETF market in 2022:
- Assets under management (AUM): Grow from $293.1 billion at the start of the year to exceed $425 billion by year end 2022
- Full year cash flow: Another new record with over $80 billion
- Mutual fund to ETF conversions: 10+ issuers will complete Mutual Fund to ETF conversions totalling over $20 billion
- Active semi-transparent: 20+ ETFs will launch, and assets will exceed $10 billion
- Growth milestone: At least 1 issuer will eclipse $60 billon in AUM
So where are we at the halfway point of 2022?
- Assets have grown to $302.0 billion. Can we get a second half market rally?
- First half cash flow is behind 2021’s record pace, but if the second half of the year ends up matching the first half total of $41.9 billion, our prediction will come true.
- The industry welcomed six active ETFs from three separate issuers via conversion from mutual funds with combined assets on conversion of $16.4 billion. A few additional issuers are public with conversion plans, but this prediction may need a nudge to come true.
- 6 new active semi-transparent ETFs came to market in the first half and assets stand at $4.2 billion. The current investable asset class limitation to U.S. equity appears to be a real headwind.
- Dimensional ended the first half with $53.5 billion in assets. If their flows match the first half ($9.1 billion), this prediction should come true.
Beyond our bold predictions, there are three additional stats from the first half that stood out to us:
- Firms with postive cash flow: 135 firms, or roughly 75% of firms
- ETFs with postive cash flow: 546 active ETFs, or nearly 65% of all products
- ETFs launched: 110 active ETFs launched through Q2 compared to 127 ETFs for first half 2021
Quarterly Active ETF Cash Flows
Source: Factset as of 6/30/2022
Source: Factset as of 6/30/2022
The actively managed ETF industry again grew across all asset classes through the first half. Equity flows continued to be the story of the industry, leading the way with $30.7 billion. Investors favored domestic equity exposure to international and value to growth. Notably, ETFs focused on yield via a dividend tilt and/or an options overlay were leaders. Commodities, $5.6 billon, cooled in the second quarter after a record first quarter in 2022. Fixed income flows, $3.4 billion, fell to third in asset class flows, and experienced their slowest growing first half over the last decade. The flows that did come in favored ultra and short-term ETFs as well as senior loans. Alternatives, $1.5 billion, gained their largest first half cash flow on record. Investors poured more money into these ETFs in first half of the year, than in the prior three years combined. Flows favored a combination of managed futures and real return strategies that focus on minimizing the impact of rising rates and inflation.
Active ETF Fund Flows by Asset Class
| Global Equity | Domestic Equity | Domestic Fixed Income | Global Fixed Income | Commodities | Asset Allocation | Alternatives | Currency |
|---|
| ARK | Dimensional | JPMorgan | First Trust | Invesco | ETC | First Trust | ProShares |
| $13.8 | $38.7 | $25.9 | $17.5 | $8.7 | $1.8 | $0.9 | $0.6 |
| Dimensional | JPMorgan | JPMorgan | Dimensional | Invesco | Cambria | State Street | ProShares |
| $3.6 | $5.9 | $1.3 | $1.0 | $3.0 | $0.2 | $0.3 | $0.1 |
Source: Factset as of 6/30/2022
At the issuer level, JPMorgan continued to pace the industry with $9.5 billion in new flows. They were led by the combination of strong flows into JEPI ($5.9 billion) and JPST ($1.3 billion). Right behind them sits Dimensional with $9.1 billion, led by their suite of Core ETFs. Rounding out the top five for the first half of the year were First Trust ($5.0 billion), American Century ($4.3 billion) and Invesco ($2.5 billion). Collectively, the top five issuers by assets accounted for 50% of cash flow -- a continuation of the downward trend we previously discussed and a new low watermark for the last five years.
H1 2022 Cash Flow Leaders by Asset Class
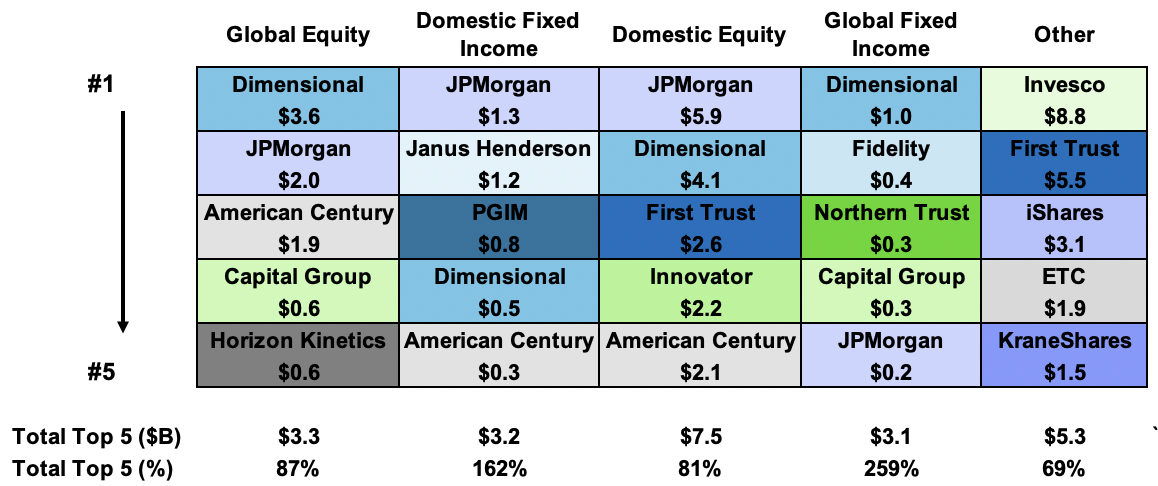
% Flows Going to Top 5 Issuers
Source: Factset as of 6/30/2022
Across the industry, nearly 75% of issuers experienced positive cash flow during the first half and nearly 30% saw inflows exceeding $50 million. Just outside of the top five, Innovator ($2.3 billion), Capital Group ($2.2 billion- 2022 market entrant) and Janus Henderson ($1.2 billion) all surpassed the $1 billion cash flow mark. Other notables included PGIM ($0.84 billion, 1x 2021 full year flows), abrdn ($0.61 billion, 1.25x 2021 full year flows), Horizon Kinetics ($0.60 billion, 2021 entrant), Goldman Sachs ($0.49 billion, 2.2x 2021 full year flows) and iM Global Partners ($0.25 billion, 5x 2021 full year flows). All told, roughly 50% of issuers experienced more cash flow in the first half than through all of 2021.
Top 5 Issuers by Cash Flow Annually (2017- H1 2022)
| Ticker | Top 10 ETFs by Cash Flow ($B) | H1 2022 ($M) |
|---|
| JPMorgan Equity Premium Income ETF | $5,848 |
| Invesco Optimum Yield Diversified Commodity Strategy No K-1 ETF | $2,984 |
| First Trust Global Tactical Commodity Strategy Fund | $2,439 |
| Dimensional U.S. Core Equity 2 ETF | $1,641 |
| Avantis U.S. Small Cap Value ETF | $1,362 |
| | $1,347 |
| JPMorgan Ultra-Short Income ETF | $1,285 |
| JPMorgan ActiveBuilders Emerging Markets Equity ETF | $1,223 |
| First Trust Enhanced Short Maturity ETF | $1,126 |
| Janus Detroit Street Trust Janus Henderson AAA CLO ETF | $1,100 |
| Ticker | Bottom 10 ETFs by Cash Flow ($B) | H1 2022 ($M) |
|---|
| PIMCO Enhanced Short Maturity Active ETF | $(1,759) |
| JPMORGAN HIGH YIELD RESEARCH ENHANCED ETF | $(1,528) |
| First Trust TCW Opportunistic Fixed Income ETF | $(1,050) |
| First Trust Low Duration Opportunities ETF | $(826) |
| Quadratic Interest Rate Volatility & Inflation Hedge ETF | $(746) |
| iShares U.S. ETF Trust iShares GSCI Commodity Dynamic Roll Strategy ETF | $(746) |
| iShares Interest Rate Hedged Long-Term Corporate Bond ETF | $(688) |
| | $(614) |
| Invesco Ultra Short Duration ETF | $(554) |
| ARK Next Generation Internet ETF | $(446) |
Source: Factset as of 6/30/2022
At the product level, nearly 65% of active ETFs saw positive flows in the first half and 150 experienced flows over $50 million (often viewed as a break-even measure for an ETF). Notably, over the last year we observed the industry’s asset weighted expense ratio tick down from 0.52% to 0.42%. A deeper dive reveals an interesting market reversal as ETFs priced at or below 0.46% secured 65% of the flows through the first half. When we completed a similar analysis in 2021 (shown below), the opposite held true with nearly an identical percentage of flows going to ETFs over the market average expense ratio. Despite this reversal, new active ETF pricing continues to favor prices north of 0.50%, as evidenced by nearly 70% of ETFs launched over the last year falling into this bucket. This is a trend to watch!
Source: Factset as of 6/30/2022
As the industry enters the second half of the year, we will be keeping a watchful eye on the evolving active ETF market and how our five bold predictions for 2022 play out.
First Half Launch Montior
Domestic Equity
36 ETFs Launched
$9.3 B Assets Raised
Domestic Fixed Income
13 ETFs Launched
$$1.5 B Assets Raised
Domestic Equity
36 ETFs Launched
$9.3 B Assets Raised
Domestic Fixed Income
13 ETFs Launched
$$1.5 B Assets Raised
Alternatives
4 ETFs Launched
$202 B Assets Raised
Int'l/Global Equity
36 ETFs Launched
$9.605 B Assets Raised
Asset Allocation
9 ETFs Launched
$195 M Assets Raised
Int'l Global Fixed Income
5 ETFs Launched
$420 M Assets Raised
Asset Allocation
9 ETFs Launched
$195 M Assets Raised
Int'l Global Fixed Income
5 ETFs Launched
$420 M Assets Raised
Source: FactSet as of 06/30/2022, figures include MF-ETF conversions
Active ETF Stat Pack
| Firms | | | |
|---|
| # of Issuers | 179 | | |
| # of New Issuers 2022 | 27 | | |
| Products | | Assets | |
|---|
| # of ETFs | 848 | AUM ($B) | $302.69 |
| # of New Launches 2022 | 110 | 3 Yr AUM CAGR | 156% |
| Avg. ER | 0.46% | 5 Yr AUM CAGR | 54% |
| Cash Flow | | Trading | |
|---|
| YTD Cash Flow ($B) | $41.30 | YTD ADV (Shares) | 127,607,543 |
| 3 Yr Cash Flow | $207.30 | YTD ADV ($) | $5.23 B |
| 5 Yr Cash Flow | $255.80 | YTD Avg. Spread (bps)* | 32.70 |
Source: Factset & NYSE Internal Database and Consolidated Tape Statistics as of 2/14/2022
*Simple average
Active, Semi-Transparent ETFs
| Ticker | Inception | Name | AUM | YTD Cash Flow | 30-Day Med. Spread (bps) | ADV (shares) | Structure | LMM | Expense Ratio |
|---|
| EQOP | 09/17/2020 | Natixis U.S. Equity Opportunities ETF | $8,120,271 | $623,987 | 14.21 | 1,039 | NYSE AMS | Citadel | 0.90% |
| VNSE | 09/17/2020 | Natixis Vaughan Nelson Select ETF | $7,520,814 | $3,983,733 | 10.895 | 1,709 | NYSE AMS | Citadel | 0.80% |
| VNMC | 09/17/2020 | Natixis Vaughan Nelson Mid Cap ETF | $7,150,402 | $(288,632) | 14.58 | 539 | NYSE AMS | Citadel | 0.85% |
| ESGA | 07/15/2020 | American Century Sustainable Equity ETF | $120,991,680 | $(9,222,718) | 11.935 | 13,933 | NYSE AMS | Citadel | 0.39% |
| MID | 07/15/2020 | American Century Mid Cap Growth Impact ETF | $21,763,940 | $4,540,400 | 10.245 | 4,608 | NYSE AMS | Citadel | 0.45% |
| ESGY | 07/01/2021 | American Century Sustainable Growth ETF | $5,946,930 | $803,527 | 6.085 | 500 | NYSE AMS | Citadel | 0.39% |
| NDVG | 08/05/2021 | Nuveen Dividend Growth ETF | $6,081,712 | $521,067 | 7.61 | 3,557 | NYSE AMS | Citadel | 0.64% |
| NSCS | 08/05/2021 | Nuveen Small Cap Select ETF | $5,194,358 | $6,084 | 10.9 | 422 | NYSE AMS | Citadel | 0.85% |
| NWLG | 08/05/2021 | Nuveen Winslow Large-Cap Growth ESG ETF | $4,558,875 | $220,954 | 8.08 | 5,164 | NYSE AMS | Citadel | 0.64% |
| NUGO | 09/28/2021 | Nuveen Growth Opportunities ETF | $2,357,015,415 | $30,826,167 | 6.85 | 172,091 | NYSE AMS | Citadel | 0.55% |
| SAEF | 11/16/2021 | Schwab Ariel ESG ETF | $10,056,800 | $4,656,850 | 25.745 | 4,012 | NYSE AMS | Flow Traders | 0.59% |
| IWLG | 06/23/2022 | IQ Winslow Large Cap Growth ETF | $7,523,250 | $- | 18.225 | 49,668 | NYSE AMS | Citadel | 0.60% |
| IWFG | 06/23/2022 | IQ Winslow Focused Large Cap Growth ETF | $5,067,000 | $508,150 | 17.72 | 44,901 | NYSE AMS | Citadel | 0.65% |
| FDG | 04/02/2020 | American Century Focused Dynamic Growth ETF | $122,455,918 | $(17,859,205) | 11.015 | 25,777 | ActiveShares | Citadel | 0.45% |
| FLV | 04/02/2020 | American Century Focused Large Cap Value ETF | $213,151,918 | $(8,099,752) | 10.425 | 9,670 | ActiveShares | Citadel | 0.42% |
| CFCV | 05/28/2020 | ClearBridge Focus Value ETF | $3,321,321 | $339,818 | 34.07 | 263 | ActiveShares | GTS | 0.50% |
| FBCG | 06/04/2020 | Fidelity Blue Chip Growth ETF | $313,193,625 | $(17,336,340) | 24.23 | 144,038 | Fidelity Proxy | GTS | 0.59% |
| FBCV | 06/04/2020 | Fidelity Blue Chip Value ETF | $108,596,110 | $14,430,258 | 32.325 | 28,933 | Fidelity Proxy | GTS | 0.59% |
| FMIL | 06/04/2020 | Fidelity New Millennium ETF | $53,086,215 | $(4,169,738) | 31.725 | 11,468 | Fidelity Proxy | GTS | 0.59% |
| FGRO | 02/04/2021 | Fidelity Growth Opportunities ETF | $54,880,238 | $20,285,480 | 13.82 | 179,911 | Fidelity Proxy | Citadel | 0.59% |
| FMAG | 02/04/2021 | Fidelity Magellan ETF | $41,282,780 | $(286,875) | 15 | 18,728 | Fidelity Proxy | RBC | 0.59% |
| FPRO | 02/04/2021 | Fidelity Real Estate Investment ETF | $19,310,550 | $784,373 | 9.17 | 7,321 | Fidelity Proxy | Citadel | 0.59% |
| FSMO | 02/04/2021 | Fidelity Small/Mid-Cap Opportunities ETF | $25,270,135 | $(113,630) | 14.93 | 8,102 | Fidelity Proxy | RBC | 0.59% |
| FSST | 06/17/2021 | Fidelity Sustainability U.S. Equity ETF | $5,304,810 | $482,085 | 13.99 | 1,201 | Fidelity Proxy | RBC | 0.59% |
| FDWM | 06/17/2021 | Fidelity Women's Leadership ETF | $2,419,485 | $235 | 14.95 | 746 | Fidelity Proxy | RBC | 0.59% |
| TCHP | 08/05/2020 | T. Rowe Price Blue Chip Growth ETF | $224,912,426 | $55,833,536 | 12.09 | 147,768 | T Rowe Proxy | Virtu | 0.57% |
| TDVG | 08/05/2020 | T. Rowe Price Dividend Growth ETF | $141,676,732 | $38,402,083 | 10.965 | 28,772 | T Rowe Proxy | RBC | 0.50% |
| TEQI | 08/05/2020 | T. Rowe Price Equity Income ETF | $86,189,772 | $37,593,126 | 8.55 | 19,810 | T Rowe Proxy | Virtu | 0.54% |
| TGRW | 08/05/2020 | T. Rowe Price Growth Stock ETF | $37,618,685 | $6,280,358 | 12.72 | 16,147 | T Rowe Proxy | RBC | 0.52% |
| TSPA | 06/08/2021 | T. Rowe Price U.S. Equity Research ETF | $20,126,237 | $1,394,361 | 11.47 | 2,047 | T Rowe Proxy | RBC | 0.52% |
| IVDG | 12/22/2020 | Invesco Focused Discovery Growth ETF | $662,909 | $(214,240) | 10.59 | 393 | Invesco Model | Citadel | 0.59% |
| IVSG | 12/22/2020 | Invesco Select Growth ETF | $1,007,410 | $(1,820) | 10.075 | 430 | Invesco Model | Citadel | 0.48% |
| IVLC | 12/22/2020 | Invesco US Large Cap Core ESG ETF | $5,709,132 | $99,950 | 16.62 | 2,378 | Fidelity Proxy | Citadel | 0.48% |
| IVRA | 12/22/2020 | Invesco Real Assets ESG ETF | $3,132,614 | $1,085,240 | 29.675 | 1,952 | Fidelity Proxy | Citadel | 0.59% |
| LOPP | 02/01/2021 | Gabelli Love Our Planet & People ETF | $11,810,580 | $3,319,190 | 41.94 | 1,120 | ActiveShares | GTS | 0.90% |
| GGRW | 02/16/2021 | Gabelli Growth Innovators ETF | $2,486,200 | $- | 52.15 | 687 | ActiveShares | GTS | 0.90% |
| GAST | 01/05/2022 | Gabelli Asset ETF | $4,116,210 | $244,380 | 52.4 | 135 | ActiveShares | GTS | 0.90% |
| FRTY | 03/01/2021 | Alger Mid Cap 40 ETF | $26,264,250 | $1,931,375 | 41.11 | 24,315 | ActiveShares | Virtu | 0.60% |
| ATFV | 05/04/2021 | Alger 35 ETF | $9,440,625 | $(100,250) | 37.84 | 2,516 | ActiveShares | Virtu | 0.55% |
| REIT | 02/26/2021 | ALPS Active REIT ETF | $17,785,101 | $(5,027,450) | 34.26 | 6,923 | Blue Tractor | GTS | 0.68% |
| STNC | 03/16/2021 | Stance Equity ESG Large Cap Core ETF | $36,715,869 | $4,518,491 | 29.225 | 2,132 | Blue Tractor | GTS | 0.85% |
| PFUT | 05/26/2021 | Putnam Sustainable Future ETF | $6,380,666 | $545,436 | 33.455 | 1,946 | Fidelity Proxy | Virtu | 0.64% |
| PLDR | 05/26/2021 | Putnam Sustainable Leaders ETF | $5,724,496 | $6,663 | 14.715 | 220 | Fidelity Proxy | RBC | 0.59% |
| PGRO | 05/26/2021 | Putnam Focused Large Cap Growth ETF | $9,371,376 | $2,249,222 | 14.725 | 2,355 | Fidelity Proxy | RBC | 0.55% |
| PVAL | 05/26/2021 | Putnam Focused Large Cap Value ETF | $33,471,278 | $18,065,826 | 30.845 | 10,221 | Fidelity Proxy | Virtu | 0.55% |
| HFGO | 11/09/2021 | Hartford Large Cap Growth ETF | $68,563,755 | $76,032,521 | 30.715 | 196,018 | Fidelity Proxy | Citadel | 0.59% |
| SEMI | 03/30/2022 | Columbia Seligman Semiconductor and Technology ETF | $11,970,647 | $8,569,050 | 31.455 | 17,589 | Fidelity Proxy | Virtu | 0.75% |
| DCPE | 04/05/2022 | DoubleLine Shiller CAPE U.S. Equities ETF | $51,330,840 | $59,013,600 | 29.59 | 119,080 | ActiveShares | Citadel | 0.65% |
| GABF | 05/11/2022 | Gabelli Financial Services Opportunities ETF | $4,910,570 | $135,105 | 30.92 | 342 | ActiveShares | GTS | 0.00% |
| | Total/Average | $4,213,867,120 | $191,861,755 | 19.87 | 1,010,568 | | | 0.61% |
|---|
Source: FactSet & NYSE Internal Database and Consolidated Tape Statistics as of 5/13/2022
*Simple average
June Active ETF Launches
| Ticker | Name | Issuer | Asset Class | AUM |
|---|
| AHOY | Newday Ocean Health ETF | Newday | 06/07/2022 | Equity | $944,465 |
| UDI | USCF Dividend Income Fund | USCF | 06/08/2022 | Equity | $5,267,070 |
| GVLU | Gotham 1000 Value ETF | Gotham Asset Management Holdings | 06/08/2022 | Equity | $11,426,415 |
| LONZ | PIMCO Senior Loan Active Exchange-Traded Fund | Allianz | 06/09/2022 | Fixed Income | $64,728,700 |
| JIRE | JPMorgan International Research Enhanced Equity ETF | JPMorgan Chase | 06/13/2022 | Equity | $5,195,431,166 |
| SYII | Syntax Stratified Total Market II ETF | Syntax Advisors | 06/16/2022 | Equity | $13,616,120 |
| OAIE | Optimize AI Smart Sentiment Event-Driven ETF | Optimize | 06/16/2022 | Alternatives | $488,292 |
| BUFQ | FT Cboe Vest Fund of Nasdaq-100 Buffer ETFs | First Trust | 06/16/2022 | Equity | $2,029,891 |
| IWLG | IQ Winslow Large Cap Growth ETF | New York Life | 06/23/2022 | Equity | $7,523,250 |
| IWFG | IQ Winslow Focused Large Cap Growth ETF | New York Life | 06/23/2022 | Equity | $5,003,620 |
| CLOI | VanEck CLO ETF | VanEck | 06/23/2022 | Fixed Income | $25,110,000 |
| NSPY | NightShares 500 ETF | Alphatrai Funds, Inc. | 06/28/2022 | Asset Allocation | $3,911,250 |
| NIWM | NightShares 2000 ETF | Alphatrai Funds, Inc. | 06/28/2022 | Asset Allocation | $3,000,900 |
| Total - 13 New ETFs | | | | $5,338,481,139 |
|---|
Source: Factset as of 6/30/2022