A Half-Year Unlike Any Other
July 15, 2021
At the beginning of 2021, the New York Stock Exchange made five bold predictions for active ETFs in 2021:
- Assets under management (AUM): Grow from $172.8 billion at the start of the year to exceed $300 billion by year end 2021
- Full year cash flow: Leapfrog 2020’s record of $60 billion and rise to over $70 billion
- Mutual fund to ETF conversions: 5+ issuers convert totaling over $40 billion in AUM
- Active semi-transparent: 25 ETFs will launch, and assets will exceed $2.5 billion
- Issuer milestone: At least 1 issuer will eclipse $50 billon in AUM
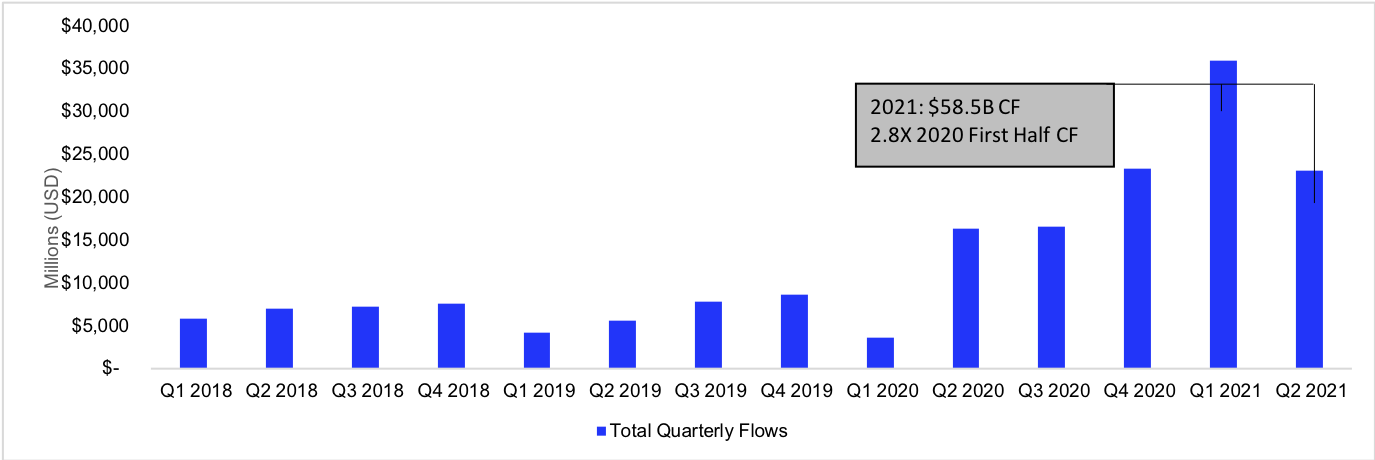
So where are we at the halfway point of 2021? Assets have grown to $263.8 billion. Well within striking distance for the second half. Full year cash flow has nearly surpassed a record 2020 with $58.5 billion year-to-date. Might as well call this a lock. The industry welcomed seven new active ETFs from three separate issuers via conversion from legacy mutual funds with combined assets of $28.8 billion. Based on the pipeline of public conversions this will come down to the wire. 23 new active semi-transparent assets came to market in the first half and assets stand at $1.8 billion. # of new ETFs are a lock and total assets seems likely. Lastly, ARK Invest ended the first half with $49.5 billion in assets. Might as well call this a lock as well. Morale of the story, maybe we weren’t bold enough.
Beyond our bold predications there are three additional stats from the first half that stood out to us:
- Firms with postive cash flow: 100 firms or roughly nine out of ten firms
- Products with positive cash flow: 438 active ETFs or nearly three quarters off all products
- Products launched: 127 active ETFs launched through Q2 compared to 167 ETFs for full year 2020
The Growth of Active ETFs
Source: FactSet as of 6/30/2021
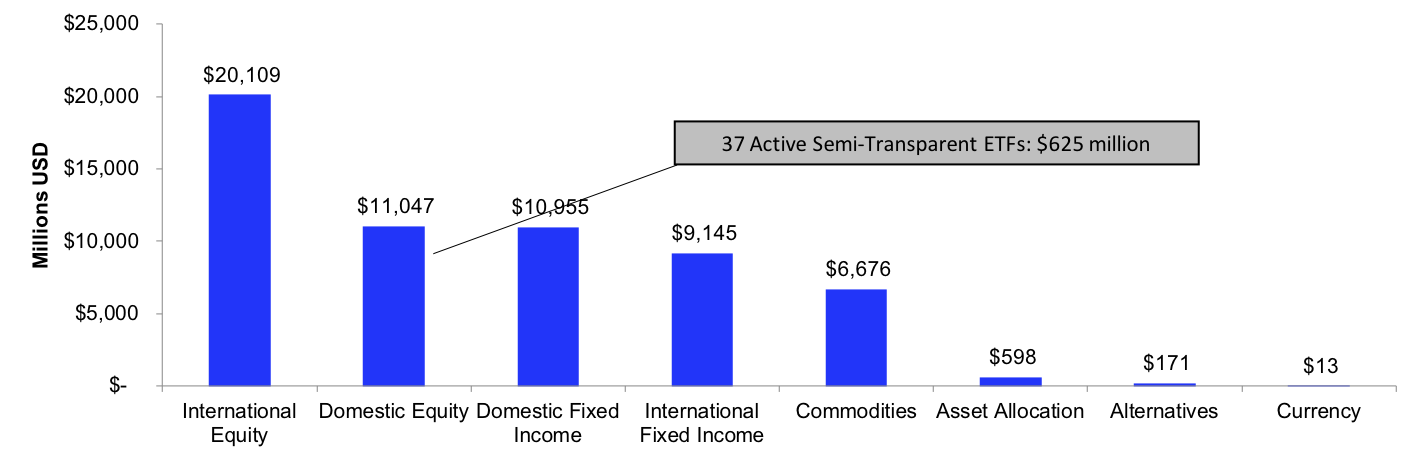
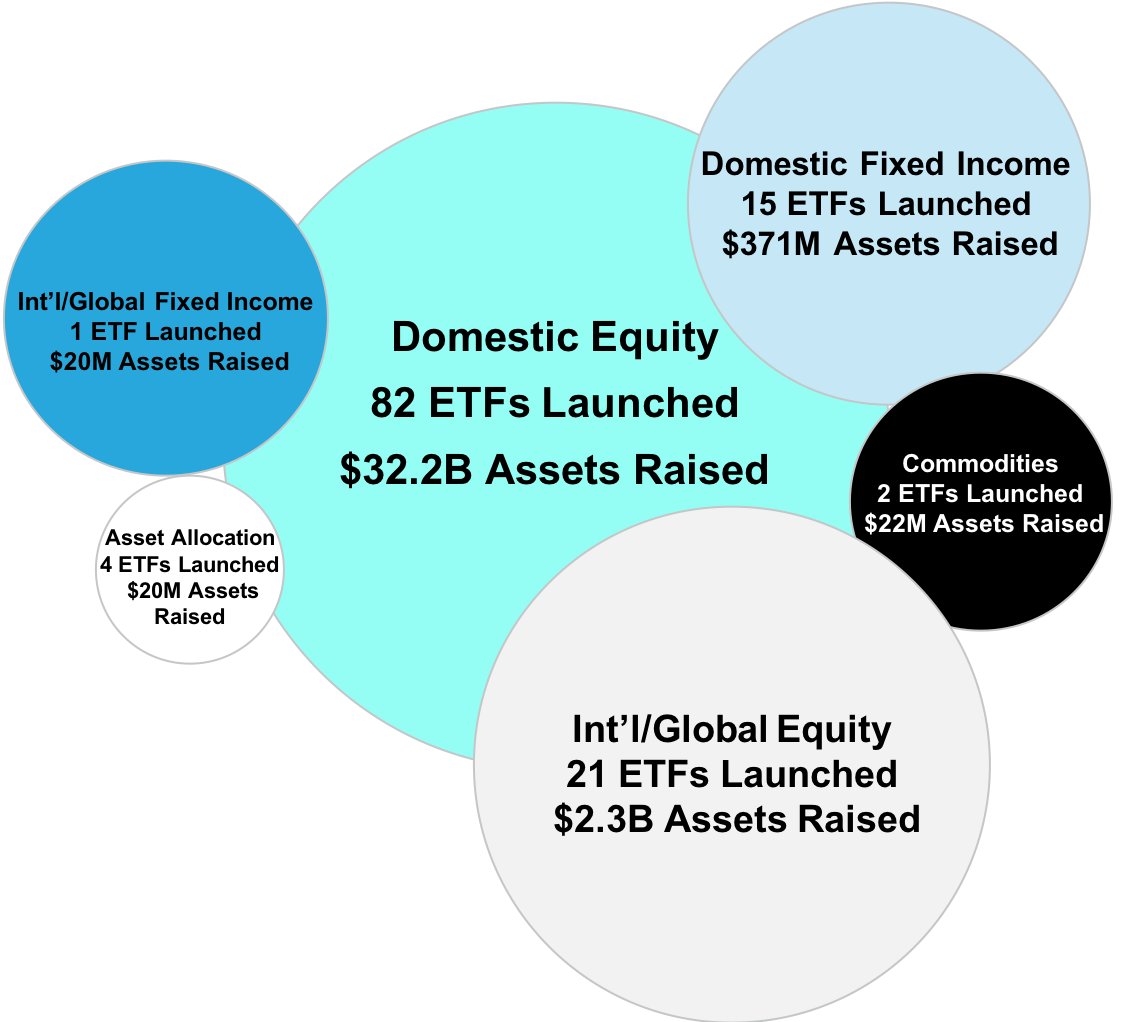
The actively managed ETF industry grew across all asset classes through the first half. Equity flows continue to be the story of the industry, leading the way with $31.2 billion. Thematic ETFs (i.e., Innovation, Robotics, Future Health, etc.) dominated flows with over $18 billion, followed by large cap core and dividend focused style ETFs as well as ESG strategies. Fixed income flows, $20.2 billion, fell into second for the first time in the last half decade. With flows favoring high yield and senior loan portfolios as well as ultra and short-term ETFs. Quietly commodities, $6.6 billon, are experiencing a renaissance led by broad commodity strategies. Year to date commodity cash flow is more than two times greater than the prior three full year combined.
Active ETF Fund Flows by Asset Class
Source: FactSet as of 6/30/2021
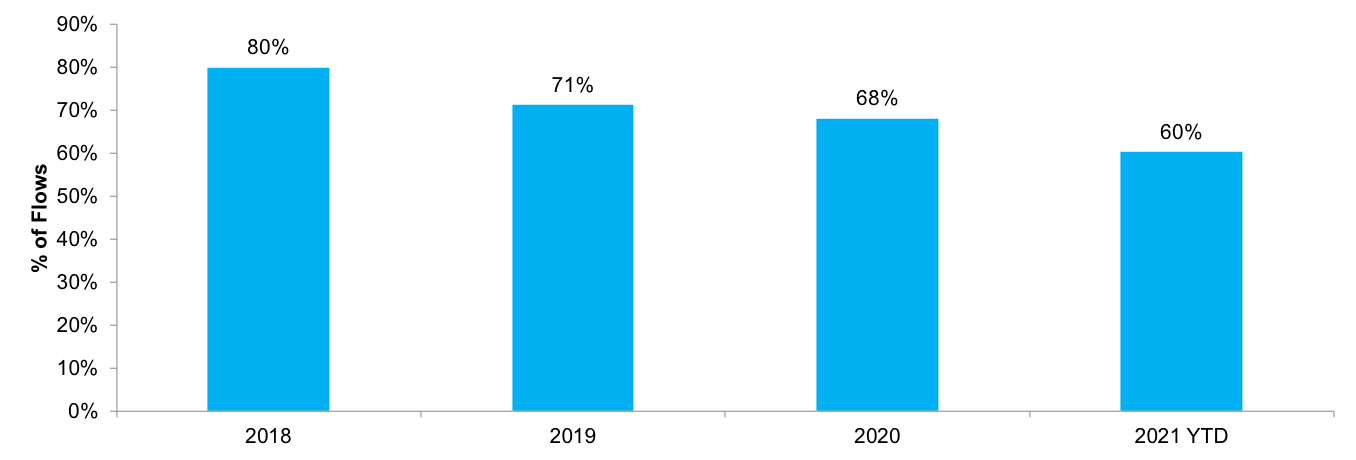
At the issuer level, ARK Invest continues to pace the industry with $15.5 billion in new flows. Behind them sits First Trust with $6.3 billion largely spread across their fixed income, preferred stock and commodities lineup. Rounding out the top five for the first half are JPMorgan ($5.8 billion), State Street ($4.2 billion) and Blackrock/iShares ($4.2 billion). Note that Dimensional/DFA’s conversions were excluded from the list as new cash flow, if included they would vault to number one with over $29 billion in converted and organic flows. Collectively, the top five issuers accounted for 60% of cash flow -- 10% lower than at the end of 2020.
% Flows Going to Top 5 Issuers
Source: FactSet & NYSE as of 6/30/2021
Across the industry, nearly 90% of issuers experienced positive cash flow during the first half and nearly 40% saw inflows exceeding $100 million. Just outside of the top five, Invesco ($2.65 billion), American Century ($2.63 billion), Quadratic ($2.60 billion), Dimensional/DFA ($1.36 billion) and Amplify ($1.34 billion) all surpassed the $1 billion cash flow mark. Other notables included AdvisorShares ($0.97 billion, 3x 2020 flows), Horizon Kinetics ($0.59 billion, first time issuer & 2021 entrant), KraneShares ($0.43 billion, 2020 entrant), and Simplify ($0.37 billion, first time issuer & 2020 entrant). All told, 55% of issuers experienced more cash flow in the first half than through all of 2020.
|
Top 10 ETFs by Cash Flow ($B) |
||
|---|---|---|
ARKK |
ARK Innovation |
7.73 |
SRLN |
SPDR Blackstone/GSO Senior Loan |
3.97 |
ARKG |
ARK Genomic Revolution |
3.03 |
IVOL |
Quadratic Interest Rate Vol. & Infl. Hedge |
2.64 |
PDBC |
Invesco Opt. Yld. Diversified Commodity |
2.30 |
ARKF |
ARK Fintech Innovation |
2.10 |
COMT |
iShares Commodities Select |
2.06 |
JPST |
JPMorgan Ultra-Short Income |
1.78 |
JEPI |
JPMorgan Equity Premium Income |
1.63 |
ARKQ |
ARK Autonomous Tech & Robotics |
1.34 |
|
Top 10 Total Cash Flow |
28.58 |
|
Bottom 10 ETFs by Cash Flow ($B) |
||
|---|---|---|
FTSM |
First Trust Enhanced Short Maturity |
(0.68) |
MINT |
PIMCO Enhanced Short Maturity |
(0.26) |
DFEB |
FT Cboe Vest U.S. Equity Deep Buffer- Feb. |
(0.18) |
PSEP |
Innovator S&P 500 Power Buffer- Sep. |
(0.15) |
GDVD |
Principal Global Dividend Income |
(0.12) |
HUSV |
First Trust Horizon Managed Vol. Domestic |
(0.08) |
POCT |
Innovator S&P 500 Power Buffer-Oct. |
(0.08) |
AWTM |
Aware Ultra Short Duration Enhanced Inc. |
(0.07) |
FTSD |
Franklin Liberty Short Duration U.S. Gov’t. |
(0.06) |
PDEC |
Innovator S&P 500 Power Buffer- Dec. |
(0.06) |
|
Bottom 10 Total Cash Flow |
(1.73) |
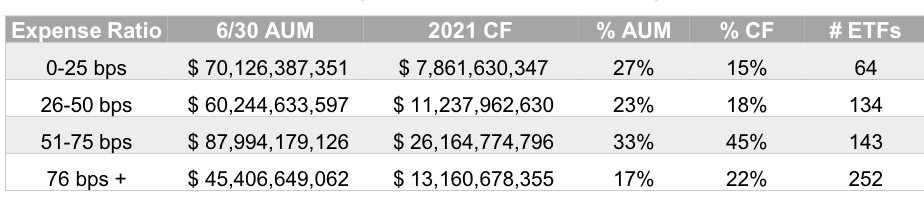
At the product level, nearly 75% of active ETFs saw positive flows in the first half and 130 experienced flows over $50 million (often viewed as a break-even measure for an ETF). Additionally, unlike the broader ETF industry those ETFs priced at the lowest range aren’t dominating flows. Year-to-date ETFs priced at or above the active ETF market average of 0.52 bps secured 66% of the flows.
Flows by Expense Ratio Range
Source: FactSet as of 6/30/2021
This pricing dynamic is likely one of the factors contributing to the accelerated pace of active launches relative to passive. Through the first half of the year 127 active ETFs launched or 61% of all ETF launches. At this pace the industry will easily break the 2020 record of 167 active launches.
Increase in Active ETF Launches
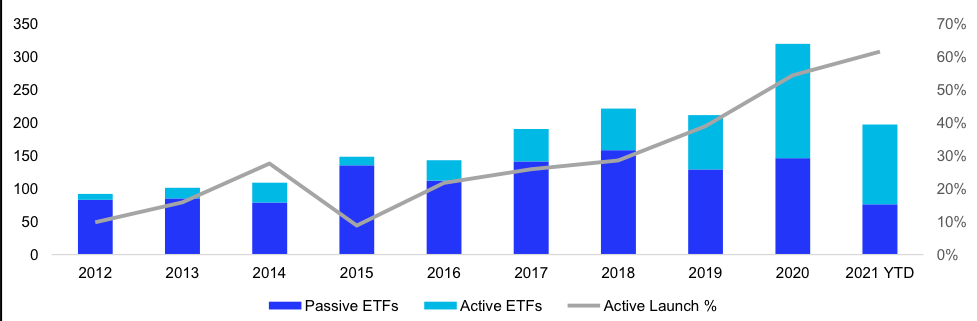
Source: FactSet as of 6/30/2021
As the industry enters the second half of the year, we will be keeping our eye on how distribution dynamics are evolving across the industry, the growth of semi-transparent stratigies and potential for expansion into new asset classes as well as the overall launch pace and adoption of active ETFs.
First Half Launch Monitor
Active ETF Stat Pack
| Firms | |||
| # of Issuers | 117 | ||
| # of New Issuers 2021 | 24 | ||
| Products | Assets | ||
| # of ETFs | 593 | AUM ($B) | $263.77 |
| # of New Launches 2021 | 127 | 3 Yr AUM CAGR | 168% |
| Avg. ER | 0.52% | 5 Yr AUM CAGR | 61% |
| Cash Flow | Trading | ||
| YTD Cash Flow ($B) | $58.50 | YTD ADV (Shares) | 64.392,290 |
| 3 Yr Cash Flow | $159.70 | YTD ADV ($) | $3.95B |
| 5 Yr Cash Flow | $191.20 | YTD Avg. Spread (bps)* | 28.77 |
Source: Factset & NYSE Internal Database and Consolidated Tape
Statistics as of 6/30/2021
*Simple average
Active, Semi-Transparent Update
|
Ticker |
Inception |
Name |
AUM |
YTD Cash Flow |
Avg. Spread (bps) |
ADV (shares) |
Structure |
LMM |
Expense Ratio |
| EQOP | 09/17/2020 | Natixis U.S. Equity Opportunities ETF | $14,111,524 | $342,319 | 14.67 | 64 | NYSE AMS | Citadel | 0.90% |
| VNSE | 09/17/2020 | Natixis Vaughan Nelson Select ETF | $6,878,818 | ($338,859) | 15.62 | 744 | NYSE AMS | Citadel | 0.90% |
| VNMC | 09/17/2020 | Natixis Vaughan Nelson Mid Cap ETF | $10,829,204 | $1,586,361 | 15.04 | 1,557 | NYSE AMS | Citadel | 0.85% |
| ESGA | 07/15/2020 | American Century Sustainable Equity ETF | $148,999,962 | $21,308,317 | 14.8 | 9,709 | NYSE AMS | Citadel | 0.39% |
| MID | 07/15/2020 | American Century Mid Cap Growth Impact ETF | $17,716,577 | $8,695,818 | 14.96 | 2,241 | NYSE AMS | Citadel | 0.45% |
| ESGY | 07/1/2020 | American Century Sustainable Growth ETF | $16,059,560 | $ - | 6.08 | 125,400 | NYSE AMS | Citadel | 0.39% |
| FDG | 04/02/2020 | American Century Focused Dynamic Growth ETF | $240,921,190 | $1,257,448 | 11.21 | 30,334 | ActiveShares | Citadel | 0.45% |
| FLV | 04/02/2020 | American Century Focused Large Cap Value ETF | $248,322,305 | $61,726,018 | 14.63 | 10,044 | ActiveShares | Citadel | 0.42% |
| CFCV | 05/28/2020 | ClearBridge Focus Value ETF | $4,002,320 | $352,062 | 24.5 | 717 | ActiveShares | GTS | 0.50% |
| FBCG | 06/04/2020 | Fidelity Blue Chip Growth ETF | $373,350,150 | $140,241,190 | 13.21 | 170,876 | Fidelity Proxy | GTS | 0.59% |
| FBCV | 06/04/2020 | Fidelity Blue Chip Value ETF | $95,724,620 | $42,845,340 | 17.7 | 50,996 | Fidelity Proxy | GTS | 0.59% |
| FMIL | 06/04/2020 | Fidelity New Millennium ETF | $63,974,680 | $35,599,248 | 13.78 | 33,539 | Fidelity Proxy | GTS | 0.59% |
| FGRO | 02/04/2021 | Fidelity Growth Opportunities ETF | $34,130,240 | $30,385,285 | 5.14 | 43,905 | Fidelity Proxy | Citadel | 0.59% |
| FMAG | 02/04/2021 | Fidelity Magellan ETF | $31,170,580 | $26,685,810 | 11.45 | 35,617 | Fidelity Proxy | RBC | 0.59% |
| FPRO | 02/04/2021 | Fidelity Real Estate Investment ETF | $14,819,313 | $11,532,688 | 4.34 | 15,084 | Fidelity Proxy | Citadel | 0.59% |
| FSMO | 02/04/2021 | Fidelity Small/Mid-Cap Opportunities ETF | $24,349,503 | $21,315,508 | 13.8 | 23,915 | Fidelity Proxy | RBC | 0.59% |
| FSST | 6/17/21 | Fidelity Sustainability U.S. Equity ETF | $2,024,420 | $ - | 9.93 | 10,288 | Fidelity Proxy | RBC | 0.59% |
| FDWM | 6/17/21 | Fidelity Women's Leadership ETF | $2,029,750 | $ - | 11.15 | 4,405 | Fidelity Proxy | RBC | 0.59% |
| TCHP | 08/05/2020 | T. Rowe Price Blue Chip Growth ETF | $173,413,915 | $95,705,287 | 8.29 | 48,547 | T Rowe Proxy | Virtu | 0.57% |
| TDVG | 08/05/2020 | T. Rowe Price Dividend Growth ETF | $67,862,266 | $25,146,531 | 5.56 | 13,332 | T Rowe Proxy | RBC | 0.50% |
| TEQI | 08/05/2020 | T. Rowe Price Equity Income ETF | $48,326,926 | $20,603,819 | 9.74 | 9,879 | T Rowe Proxy | Virtu | 0.54% |
| TGRW | 08/05/2020 | T. Rowe Price Growth Stock ETF | $40,947,214 | $10,692,005 | 6.45 | 6,765 | T Rowe Proxy | RBC | 0.52% |
| TSPA | 06/08/2021 | T. Rowe Price U.S. Equity Research ETF | $16,116,796 | $876,766 | 8.81 | 3,825 | T Rowe Proxy | - | 0.52% |
| IVDG | 12/22/2020 | Invesco Focused Discovery Growth ETF | $1,392,613 | $120,580 | 16.47 | 1,408 | Invesco Model | Citadel | 0.59% |
| IVSG | 12/22/2020 | Invesco Select Growth ETF | $1,374,414 | $ - | 15.38 | 1,016 | Invesco Model | Citadel | 0.48% |
| IVLC | 12/22/2020 | Invesco US Large Cap Core ESG ETF | $6,724,284 | $5,298,630 | 15.25 | 4,271 | Fidelity Proxy | Citadel | 0.48% |
| IVRA | 12/22/2020 | Invesco Real Assets ESG ETF | $1,822,874 | $433,080 | 15.25 | 2,646 | Fidelity Proxy | Citadel | 0.59% |
| LOPP | 02/01/2021 | Gabelli Love Our Planet & People ETF | $9,926,510 | $6,106,750 | 10.95 | 3,258 | ActiveShares | GTS | 0.90% |
| GGRW | 02/16/2021 | Gabelli Growth Innovators ETF | $3,809,700 | $1,158,250 | 12.54 | 810 | ActiveShares | GTS | 0.90% |
| FRTY | 03/01/2021 | Alger Mid Cap 40 ETF | $26,844,375 | $20,772,625 | 49.05 | 22,200 | ActiveShares | Virtu | 0.60% |
| ATFV | 05/04/2021 | Alger 35 ETF | $11,438,000 | $11,739,625 | 35.39 | 15,834 | ActiveShares | Virtu | 0.55% |
| REIT | 02/26/2021 | ALPS Active REIT ETF | $21,434,507 | $17,006,700 | 16 | 11,372 | Blue Tractor | GTS | 0.68% |
| STNC | 03/16/2021 | Stance Equity ESG Large Cap Core ETF | $34,993,992 | $5,393,495 | 18.79 | 4,206 | Blue Tractor | GTS | 0.85% |
| PFUT | 05/26/2021 | Putnam Sustainable Future ETF | $5,416,660 | $ - | 27.51 | 8,094 | Fidelity Proxy | Virtu | 0.64% |
| PLDR | 05/26/2021 | Putnam Sustainable Leaders ETF | $5,165,660 | $ - | 12.36 | 8,158 | Fidelity Proxy | RBC | 0.59% |
| PGRO | 05/26/2021 | Putnam Focused Large Cap Growth ETF | $6,703,325 | $ - | 12.02 | 12,989 | Fidelity Proxy | RBC | 0.55% |
| PVAL | 05/26/2021 | Putnam Focused Large Cap Value ETF | $5,795,120 | $ - | 24.56 | 8,722 | Fidelity Proxy | Virtu | 0.55% |
|
|
Total/Average |
$1,838,923,863 |
$624,588,693 |
16.06 |
756,290 |
|
|
0.60% |
Source: Factset & NYSE Internal Database and Consolidated Tape
Statistics as of 6/30/2021
*Simple average
June Active ETF Launches
| Ticker | Name | Issuer | Launch Date | Asset Class | AUM |
| JUNZ | TrueShares Structured Outcome (June) ETF | TrueMark Investments | 6/1/21 | Equity | $3,809,115.00 |
| TSPA | T. Rowe Price U.S. Equity Research ETF | T. Rowe Price Group, Inc. | 6/9/21 | Equity | $16,116,795.94 |
| DFAT | Dimensional U.S. Targeted Value ETF | Dimensional Holdings | 6/14/21 | Equity | $5,881,621,744.38 |
| DFAC | Dimensional U.S. Core Equity 2 ETF | Dimensional Holdings | 6/14/21 | Equity | $13,292,117,703.36 |
| DFAS | Dimensional U.S. Small Cap ETF | Dimensional Holdings | 6/14/21 | Equity | $3,961,283,137.77 |
| DFUS | Dimensional U.S. Equity ETF | Dimensional Holdings | 6/14/21 | Equity | $5,579,372,016.93 |
| XPND | First Trust Expanded Technology ETF | First Trust | 6/15/21 | Equity | $12,525,641.75 |
| SHUS | Syntax Stratified U.S. Total Market Hedged ETF | Syntax Advisors | 6/16/21 | Equity | $43,978,000.00 |
| CUBS | Asian Growth Cubs ETF | Exchange Traded Concepts | 6/17/21 | Equity | $2,289,690.00 |
| FSST | Fidelity Sustainability U.S. Equity ETF | Fidelity | 6/17/21 | Equity | $2,024,420.00 |
| FDWM | Fidelity Women's Leadership ETF | Fidelity | 6/17/21 | Equity | $2,029,750.00 |
| FPFD | Fidelity Preferred Securities & Income ETF | Fidelity | 6/17/21 | Fixed Income | $5,012,620.00 |
| QJUN | FT Cboe Vest Growth-100 Buffer ETF - June | First Trust | 6/21/21 | Equity | $11,178,240.65 |
| YJUN | FT Cboe Vest International Equity Buffer ETF - June | First Trust | 6/21/21 | Equity | $2,028,140.56 |
| JRE | Janus Henderson U.S. Real Estate ETF | Janus Henderson | 6/23/21 | Equity | $9,903,400.00 |
| SPAX | Robinson Alternative Yield Pre-merger SPAC ETF | Toroso Investments | 6/23/21 | Equity | $1,501,545.00 |
| DYLD | LeaderShares Dynamic Yield ETF | Redwood Investment Management | 6/29/21 | Equity | $2,513,500.00 |
| ITAN | Sparkline Intangible Value ETF | Sparkline | 6/29/21 | Equity | $250,450.00 |
| ESGB | IQ MacKay ESG Core Plus Bond ETF | IndexIQ | 6/29/21 | Equity | $20,038,880.00 |
| META | Roundhill Ball Metaverse ETF | Roundhill Investments | 6/30/21 | Equity | $1,507,000.00 |
| Total | 20 New Funds | $28,851,101,791.32 |
Source: Factset as of 6/30/2021
NYSE ETF Summit & Active ETF Webinar Series Replay
Missed the April NYSE ETF Summit or our Active ETF Webinar series? Access replays from the Summit here or visit HomeofETFs.com to catch up.
Hear from ETF experts representing the various active ETF structures, fund sponsors such as American Century, Fidelity, PIMCO and T. Rowe Price, liquidity providers such as Flow Traders and Jane Street, and service providers such as BNY Mellon and State Street.