Record-Shattering Quarter for Active ETFs
april 8, 2021
Active ETFs Rise in Q1 2021
Throughout the quarter, we shared insights on the record-shattering trajectory of the active ETF market. So how did the market close out Q1?
- Assets under management (AUM): $203.5 billion (up $105 billion YoY)
- Q1 Cash Flow: $37.6 billion (up $33 billion YoY)
- # of New Active ETFs Launched: 58 ETFs
- # of New Active ETFs Filed with SEC & Yet to Launch: 55+ ETFs
First-Ever Mutual Fund to ETF Conversion
On March 29, Guinness Atkinson became the first asset manager to successfully convert two mutual funds to two new NYSE listed ETFs, SmartETFs Asia Pacific Dividend Builder (ADIV) and SmartETFs Dividend Builder ETF (DIVS). With it, a new path to the active ETF market was born. For more on mutual fund to ETF conversions and the potential paths to market, see our February conversation with Ropes & Gray.
Semi-Transparent ETF Assets Cross $1.25B Mark
On Jan. 12, the semi-transparent ETF market collectively closed with over $1 billion in AUM, an impressive feat to accomplish in under a year. Since this milestone, nine new ETFs have launched -- bringing the total to 28 -- and assets have steadily increased to $1.3 billion. For more on investor adoption, interest and entry options consider:
- Brown Brothers Harriman, Exchange Thoughts: The NYSE teamed up with BBH to co-author “Active ETFs: Helping Managers Navigate the Various ETF Structures,” a guide for asset managers on key considerations for assessing the active ETF market.
- The Wall Street Journal, Markets & ETFs: Michael Wursthorn provides perspective from bank channel executives at Bank of America and UBS on their approach to approving semi-transparent ETFs on their wealth management platforms.
- Brown Brothers Harriman, 2021 Global ETF Survey: BBH’s eighth annual global ETF investor survey reveals that 71% of U.S. investors expect to increase their exposure to active ETFs, which is a 9% increase year-over-year. 91% of investors expressed interest in semi-transparent structures, with 51% saying they would “definitely” buy in the next six months.
NYSE & Blue Tractor Receive Approval for Additional Basket Flexibility
In February and March, the SEC approved the NYSE & Blue Tractor proxy ETF structures for custom basket use. With this approval, asset managers using these models can now construct creation/redemption baskets that differ from the daily proxy and Dynamic SSRSM portfolio, much like transparent ETFs that fall under the ETF Rule do today. This further enhances the operational efficiency of these models, increases tax efficiency, and provides reduced costs for asset managers.
Visual Analysis: Q1 2021 Cash Flow
By every measure Q1 of 2021 was record-breaking. To provide context, here are a few of our favorite visuals. Enjoy!
Quarterly Active ETF Cash Flow 2018 - 2021
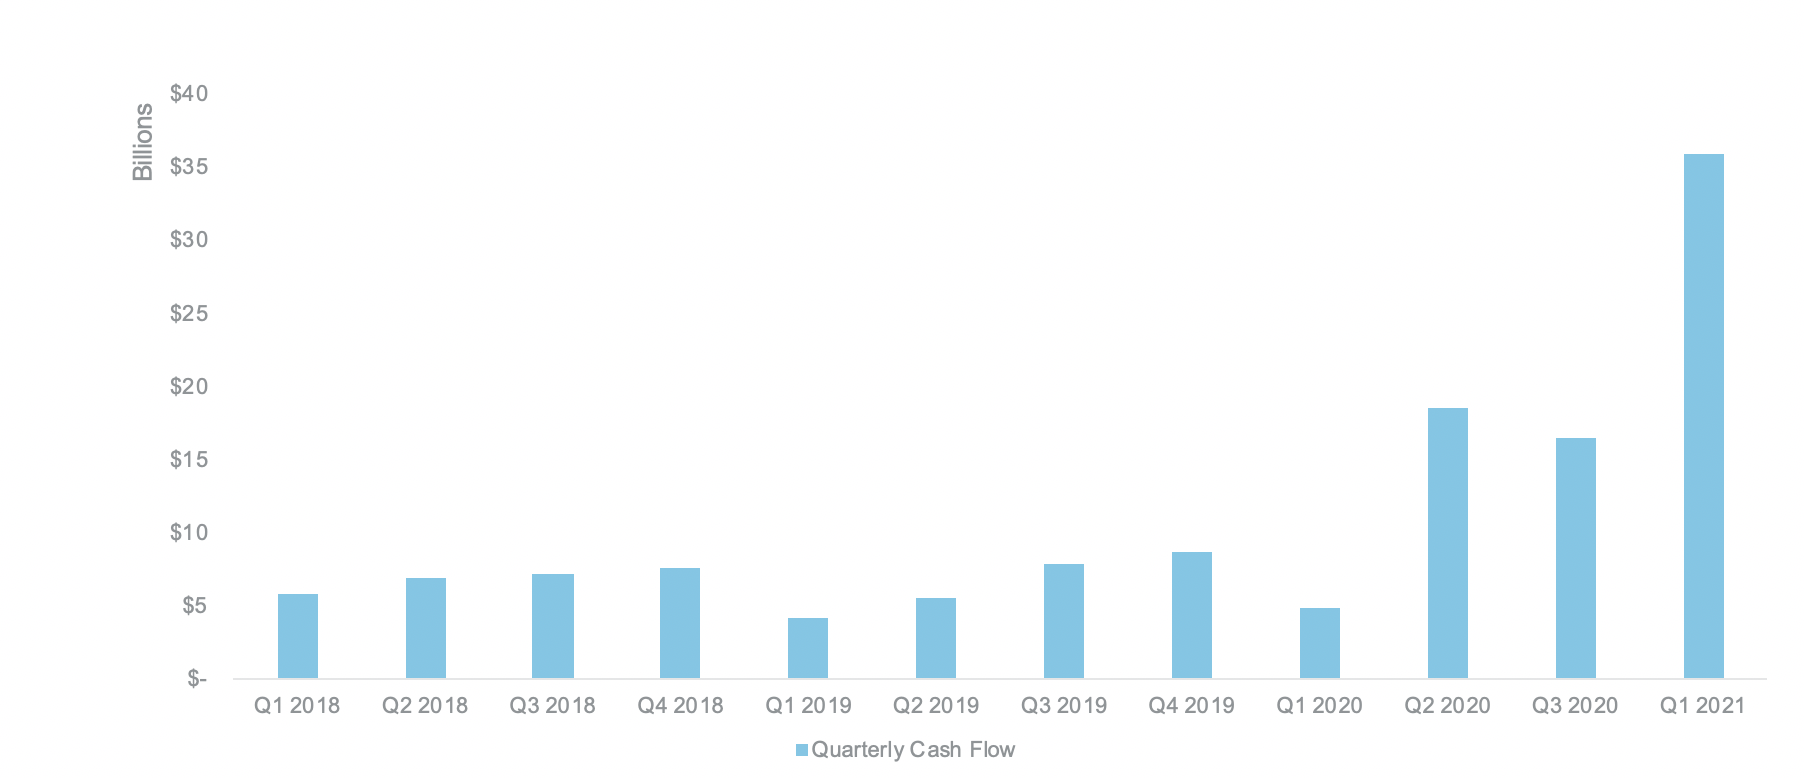
Source FactSet as of 3/31/2021
Q1 2021 Active ETF Fund Flows by Asset Class
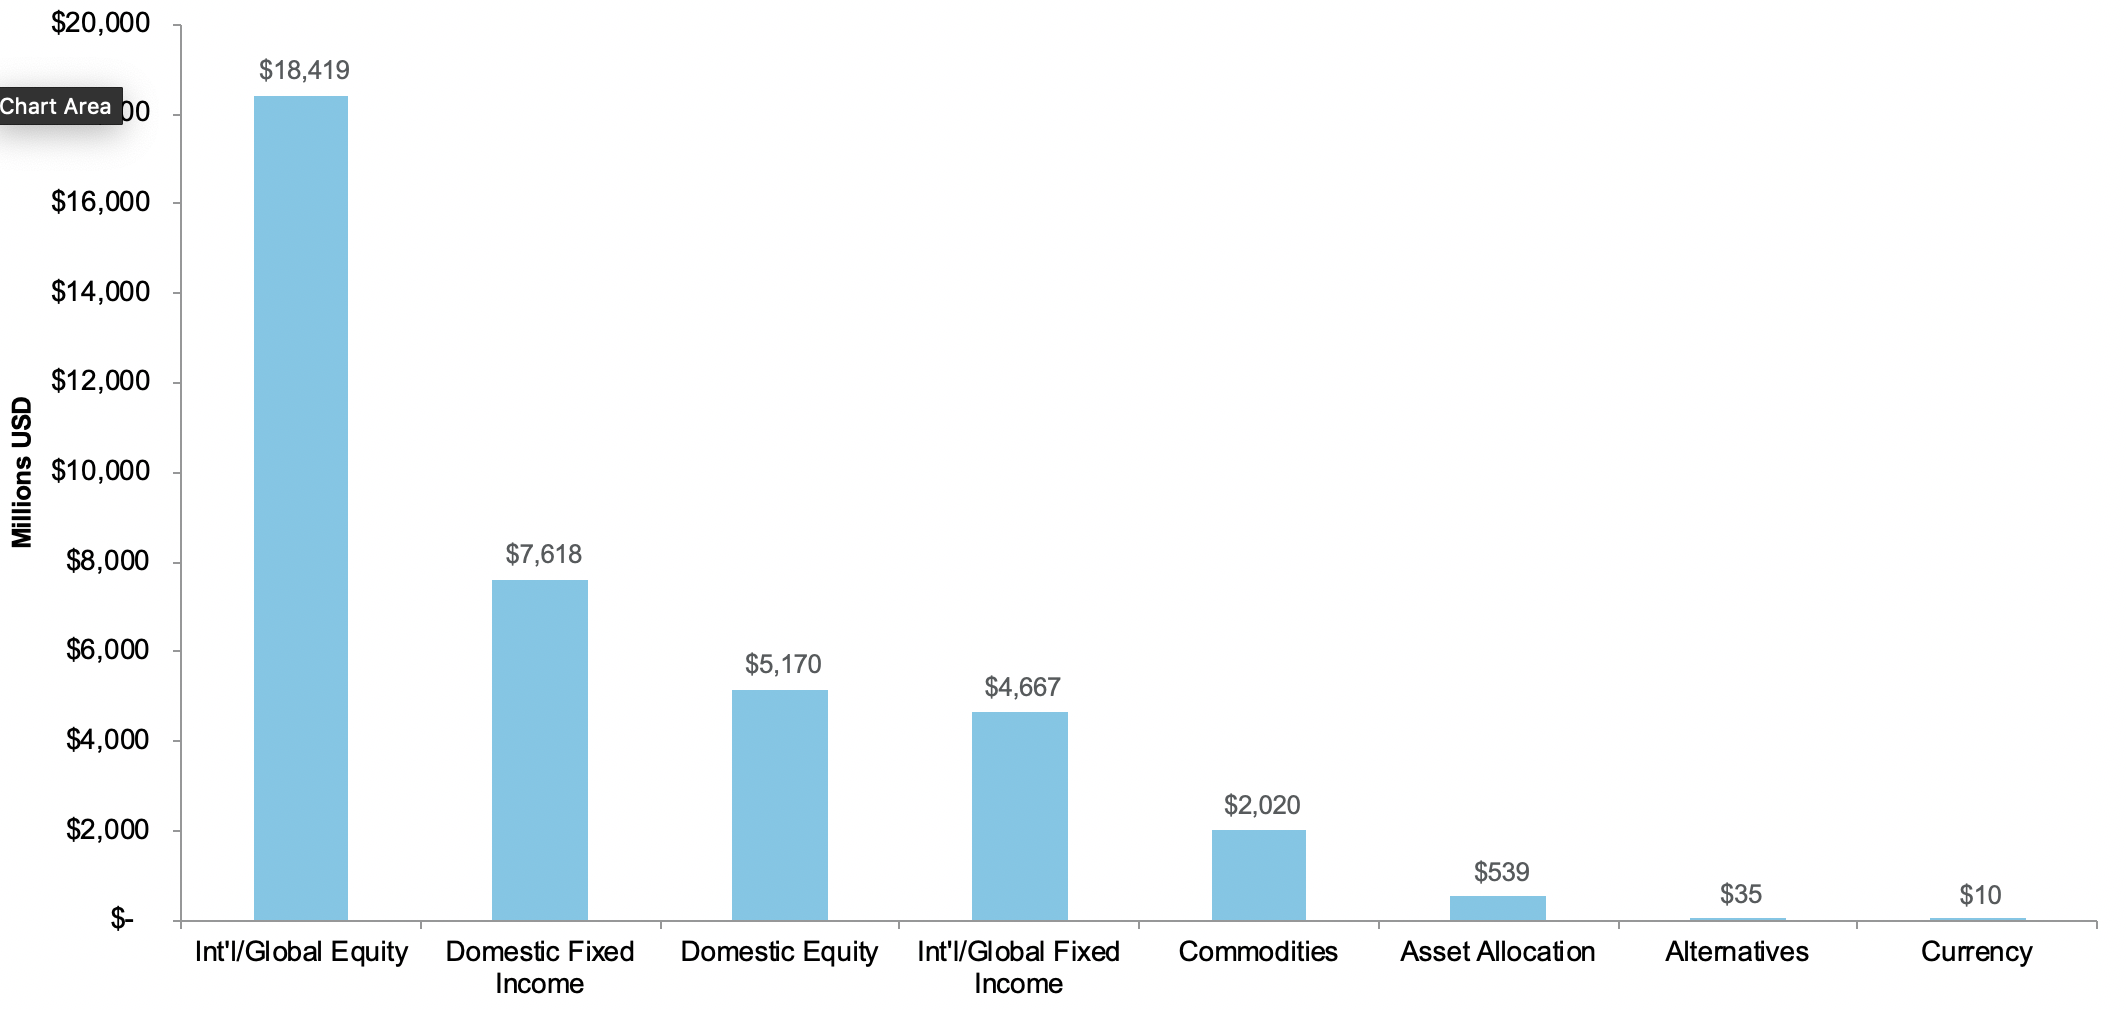
Source FactSet as of 3/31/2021
Q1 2021 Cash Flow Leaders by Asset Class
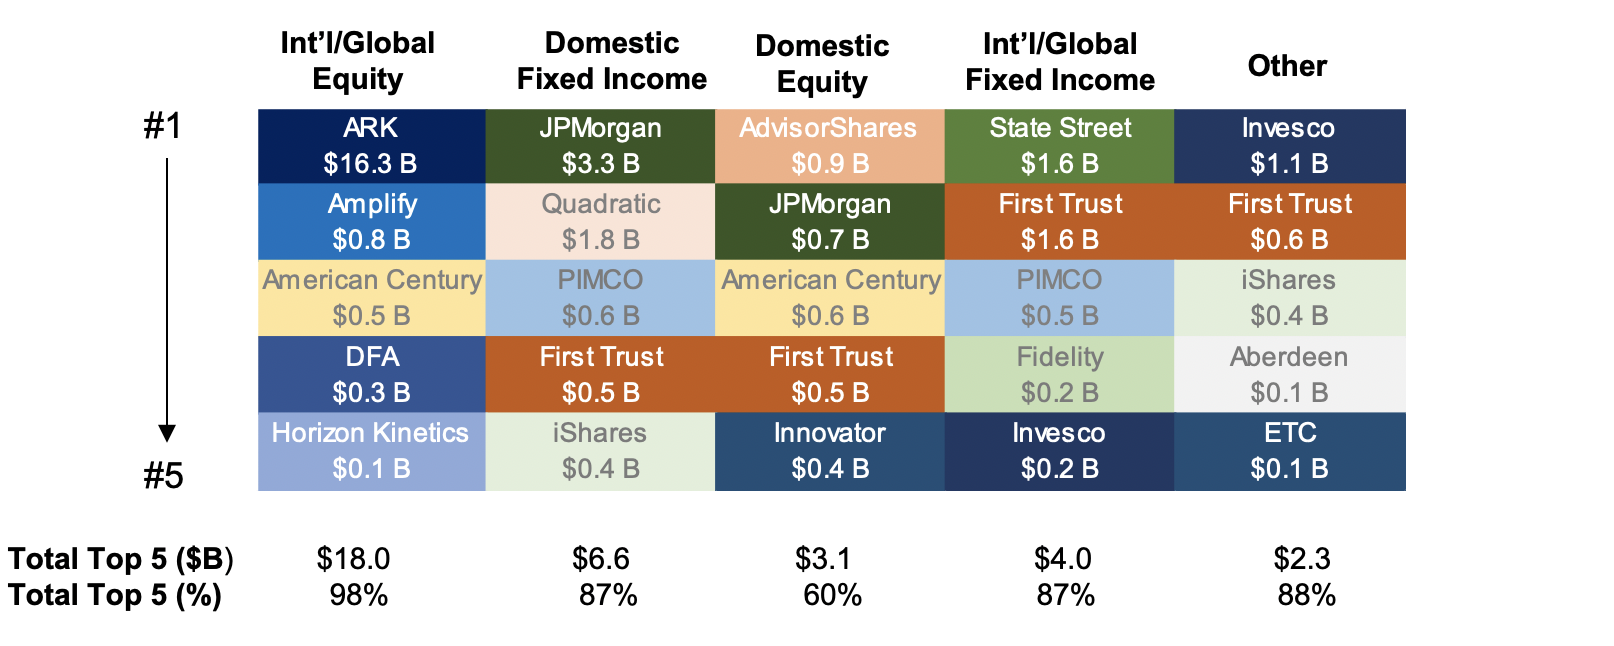
Source FactSet as of 3/31/2021
Top 10 ETFs by Cash Flow ($B)
| Top 10 ETFs by Cash Flow ($B) | Q1 2021 ($M) | |
|---|---|---|
| ARKK | ARK Innovation ETF | $7,238 |
| ARKG | ARK Genomic Revolution ETF | $2,960 |
| ARKF | ARK Fintech Innovation ETF | $2,272 |
| ARKW | ARK Next Generation Internet ETF | $1,846 |
| IVOL | Quadratic Interest Rate Volatility & Inflation Hedge ETF | $1,753 |
| JPHY | JPMorgan High Yield Research Enhanced ETF | $1,661 |
| SRLN | SPDR Blackstone Senior Loan ETF | $1,642 |
| ARKQ | ARK Autonomous Technology & Robotics ETF | $1,617 |
| JPST | JPMorgan Ultra-Short Income ETF | $1,129 |
| PDBC | Invesco Optimum Yield Diversified Commodity Strategy ETF | $1,091 |
Bottom 10 ETFs by Cash Flow ($B)
| Bottom 10 ETFs by Cash Flow ($B) | Q1 2021 ($M) | |
|---|---|---|
FTSM |
First Trust Enhanced Short Maturity ETF |
$(312) |
DFEB |
FT Cboe Vest U.S. Equity Deep Buffer ETF - February |
$(114) |
FTSD |
Franklin Liberty Short Duration U.S. Government ETF |
$(103) |
HUSV |
First Trust Horizon Managed Volatility Domestic ETF |
$(78) |
AWTM |
Aware Ultra-Short Duration Enhanced Income ETF |
$(72) |
POCT |
Innovator S&P 500 Power Buffer ETF - October |
$(58) |
PSEP |
Innovator S&P 500 Power Buffer ETF - September |
$(52) |
TAIL |
Cambria Tail Risk ETF |
$(52) |
FLIA |
Franklin Liberty International Aggregate Bond ETF |
$(43) |
FLCB |
Franklin Liberty U.S. Core Bond ETF |
$(38) |
Growth has been widespread. Only one asset class — U.S. Fixed Income — has not yet experienced an increase in year-over-year growth. Across equity strategies, cash flow increased ~5X year-over-year to $5.2 billion. This expansion is supported by several new ETFs along with strong investor adoption. Nine of the top 20 ETFs by cash flow year-to-date have launched within the last calendar year. Additionally, investors continue to show interest in thematic based strategies with ETFs focused on cannabis, SPACs and blockchain technologies.
Q1 2021 Launch Monitor
In the first quarter of 2021, 58 actively managed ETFs came to market, nearing $1.8 billion in AUM, including nine semi-transparent funds. These launches subsequently brought new issuers to the ETF market, a variety of strategies spanning asset classes, the first mutual fund to ETF conversion and more.
- 11 firms launched their first actively managed funds in Q1, ranging from new entrants in the ETF space, such as Gabelli, to firms with large existing ETF businesses, such as John Hancock and United States Commodity Funds.
- On March 29, Guinness Atkinson converted two mutual funds directly into NYSE-listed ETFs under their SmartETFs brand. The two funds, SmartETFs Asia Pacific Dividend Builder (NYSE Arca: ADIV) and SmartETFs Dividend Builder (NYSE Arca: DIVS), converted as a non-taxable event for shareholders and resulted in an expense ratio reduction of approximately 44% and 5%, respectively.
- Blue Tractor’s Shielded Alpha ETF structure debuted with the launch of the Stance Equity ESG Large Cap Core ETF (NYSE Arca: STNC) and the ALPS Active REIT ETF (REIT). The Shielded Alpha wrapper is built to shield a fund advisor’s confidential alpha-generating strategy and offers a high degree of transparency for efficient trading.
- 20 defined outcome or buffer ETFs came to market in Q1, continuing a trend from 2020. Allianz, TrueShares, First Trust, and Innovator continue to expand their offerings with both domestic and international equity funds.
Across fixed income, aggregate flows are flat year-over-year at $9.2 billion. A combination of renewed interest in senior loan, inflation-protected and ultra-short-term strategies is leading growth in this sector.
Active ETF Stat Pack
| Firms | |||
| # of Issuers | 104 | ||
| # of New Issuers 2021 | 11 | ||
| Products | Assets | ||
| # of ETFs | 530 | AUM ($B) | $203.52 |
| # of New Launches 2021 | 58 | 3 Yr AUM CAGR | 161% |
| Avg. ER | 0.55% | 5 Yr AUM CAGR | 55% |
| Cash Flow | Trading | ||
| YTD Cash Flow ($B) | $37.60 | YTD ADV (Shares) | 77,223,860 |
| 3 Yr Cash Flow | $144.80 | YTD ADV ($) | $4.72B |
| 5 Yr Cash Flow | $170.50 | YTD Avg. Spread (bps)* | 29.77 |
Source: Factset & NYSE Internal Database and Consolidated Tape Statistics as of 3/31/2021
*Simple average
Active, Semi-Transparent ETFs
Ticker |
Inception |
Name |
AUM |
YTD Cash Flow |
Avg. Spread (bps) |
ADV (shares) |
Structure |
LMM |
Expense Ratio |
EQOP |
9/17/2020 |
Natixis U.S. Equity Opportunities ETF |
$ 12,995,264 |
$ - |
21.62 |
89 |
NYSE AMS |
Citadel |
0.90% |
VNSE |
9/17/2020 |
Natixis Vaughan Nelson Select ETF |
$ 6,847,488 |
$ 288,685 |
18.85 |
441 |
NYSE AMS |
Citadel |
0.90% |
VNMC |
9/17/2020 |
Natixis Vaughan Nelson Mid Cap ETF |
$ 9,929,812 |
$ 1,210,704 |
24.93 |
1,598 |
NYSE AMS |
Citadel |
0.85% |
ESGA |
7/15/2020 |
American Century Sustainable Equity ETF |
$ 133,733,351 |
$ 18,800,038 |
15.15 |
10,319 |
NYSE AMS |
Citadel |
0.39% |
MID |
07/15/2020 |
American Century Mid Cap Growth Impact ETF |
$ 11,455,451 |
$ 5,102,567 |
15.31 |
2,565 |
NYSE AMS |
Citadel |
0.45% |
FDG |
04/02/2020 |
American Century Focused Dynamic Growth ETF |
$ 216,028,246 |
$ 3,069,548 |
14.11 |
24,004 |
ActiveShares |
Citadel |
0.45% |
FLV |
04/02/2020 |
American Century Focused Large Cap Value ETF |
$ 199,457,930 |
$ 16,481,899 |
16.31 |
9,948 |
ActiveShares |
Citadel |
0.42% |
CFCV |
05/28/2020 |
ClearBridge Focus Value ETF |
$ 3,423,070 |
$ - |
33.44 |
129 |
ActiveShares |
GTS |
0.50% |
FBCG |
06/04/2020 |
Fidelity Blue Chip Growth ETF |
$ 280,477,008 |
$ 87,501,260 |
19.66 |
216,309 |
Fidelity Proxy |
GTS |
0.59% |
FBCV |
06/04/2020 |
Fidelity Blue Chip Value ETF |
$ 75,404,560 |
$ 26,471,300 |
23.33 |
54,818 |
Fidelity Proxy |
GTS |
0.59% |
FMIL |
06/04/2020 |
Fidelity New Millennium ETF |
$ 47,740,928 |
$ 21,782,133 |
23.63 |
37,552 |
Fidelity Proxy |
GTS |
0.59% |
FGRO |
02/04/2021 |
Fidelity Growth Opportunities ETF |
$ 18,128,565 |
$ 17,655,320 |
5.51 |
53,049 |
Fidelity Proxy |
Citadel |
0.59% |
FMAG |
02/04/2021 |
Fidelity Magellan ETF |
$ 18,304,918 |
$ 16,567,595 |
15.1 |
48,981 |
Fidelity Proxy |
RBC |
0.59% |
FPRO |
02/04/2021 |
Fidelity Real Estate Investment ETF |
$ 6,316,380 |
$ 4,018,255 |
5.73 |
14,989 |
Fidelity Proxy |
Citadel |
0.59% |
FSMO |
02/04/2021 |
Fidelity Small/Mid-Cap Opportunities ETF |
$ 15,812,540 |
$ 13,414,960 |
17.8 |
33,791 |
Fidelity Proxy |
RBC |
0.59% |
TCHP |
08/05/2020 |
T. Rowe Price Blue Chip Growth ETF |
$ 101,844,174 |
$ 39,547,044 |
9.83 |
48,505 |
T Rowe Proxy |
Virtu |
0.57% |
TDVG |
08/05/2020 |
T. Rowe Price Dividend Growth ETF |
$ 52,538,078 |
$ 13,635,461 |
7.13 |
15,516 |
T Rowe Proxy |
RBC |
0.50% |
TEQI |
08/05/2020 |
T. Rowe Price Equity Income ETF |
$ 34,953,086 |
$ 9,810,891 |
9.89 |
9,708 |
T Rowe Proxy |
Virtu |
0.54% |
TGRW |
08/05/2020 |
T. Rowe Price Growth Stock ETF |
$ 32,360,458 |
$ 6,519,339 |
8.28 |
8,878 |
T Rowe Proxy |
RBC |
0.52% |
IVDG |
12/22/2020 |
Invesco Focused Discovery Growth ETF |
$ 1,274,582 |
$ 120,580 |
21.41 |
1,894 |
Invesco Model |
Citadel |
0.59% |
IVSG |
12/22/2020 |
Invesco Select Growth ETF |
$ 1,216,912 |
$ - |
17.14 |
1,309 |
Invesco Model |
Citadel |
0.48% |
IVLC |
12/22/2020 |
Invesco US Large Cap Core ESG ETF |
$ 1,265,413 |
$ - |
15.4 |
774 |
Fidelity Proxy |
Citadel |
0.48% |
IVRA |
12/22/2020 |
Invesco Real Assets ESG ETF |
$ 1,303,513 |
$ - |
27.49 |
2,187 |
Fidelity Proxy |
Citadel |
0.59% |
LOPP |
02/01/2021 |
Gabelli Love Our Planet & People ETF |
$ 8,105,375 |
$ 4,729,110 |
23.01 |
6,555 |
ActiveShares |
GTS |
0.90% |
GGRW |
02/16/2021 |
Gabelli Growth Innovators ETF |
$ 2,938,005 |
$ 809,970 |
36.42 |
1,639 |
ActiveShares |
GTS |
0.90% |
FRTY |
03/01/2021 |
Alger Mid Cap 40 ETF |
$ 3,809,480 |
$ - |
37.12 |
37,365 |
ActiveShares |
Virtu |
0.60% |
REIT |
02/26/2021 |
ALPS Active REIT ETF |
$ 11,970,951 |
$ 8,995,650 |
19.57 |
21,761 |
Blue Tractor |
GTS |
0.68% |
STNC |
03/16/2021 |
Stance Equity ESG Large Cap Core ETF |
$ 29,137,207 |
$ 2,208,824 |
18.39 |
9,198 |
Blue Tractor |
GTS |
0.85% |
|
|
Total/Average |
$1,338,772,742 |
$318,741,132 |
18.63 |
673,872 |
|
|
0.61% |
Source: Factset & NYSE Internal Database and Consolidated Tape
Statistics as of 3/5/2021
*Simple average
March Active ETF Launches
| Ticker | Name | Issuer | Launch Date | Asset Class | AUM |
FRTY |
Alger Mid Cap 40 ETF |
Alger Group Holdings LLC |
03/01/2021 |
Equity |
$ 3,976,000 |
MARZ |
TrueShares Structured Outcome (March) ETF |
TrueMark Investments |
03/01/2021 |
Equity |
$ 8,987,370 |
JSCP |
JPMorgan Short Duration Core Plus ETF |
JPMorgan Chase |
03/02/2021 |
Fixed Income |
$ 62,111,600 |
IGLD |
FT Cboe Vest Gold Strategy Target Income ETF |
First Trust |
03/03/2021 |
Commodities |
$ 5,030,040 |
FIGB |
Fidelity Investment Grade Bond ETF |
Fidelity |
03/04/2021 |
Fixed Income |
$ 9,935,000 |
FSEC |
Fidelity Investment Grade Securitized ETF |
Fidelity |
03/04/2021 |
Fixed Income |
$ 9,957,000 |
JEMA |
JPMorgan Emerging Markets Equity Core ETF |
JPMorgan Chase |
03/11/2021 |
Equity |
$ 29,441,580 |
MINN |
Mairs & Power Minnesota Municipal Bond ETF |
Mairs & Power, Inc. |
03/12/2021 |
Fixed Income |
$ 7,770,305 |
STNC |
Stance Equity ESG Large Cap Core ETF |
The RBB Fund |
03/16/2021 |
Equity |
$ 29,454,360 |
MVP |
Roundhill MVP ETF |
Roundhill Investments |
03/17/2021 |
Equity |
$ 7,887,000 |
INMU |
BlackRock Intermediate Muni Income Bond ETF |
Blackrock |
30/18/2021 |
Fixed Income |
$ 25,250,000 |
HYMU |
BlackRock High Yield Muni Income Bond ETF |
Blackrock |
03/18/2021 |
Fixed Income |
$ 25,370,000 |
SYUS |
Syntax Stratified US Total Market ETF |
Syntax Advisors |
03/19/2021 |
Equity |
$ 21,390,022 |
DMAR |
FT Cboe Vest U.S. Equity Deep Buffer ETF - March |
First Trust |
03/22/2021 |
Asset Allocation |
$ 45,240,060 |
FMAR |
FT Cboe Vest U.S. Equity Buffer ETF - March |
First Trust |
03/22/2021 |
Equity |
$ 40,848,630 |
QMAR |
FT Cboe Vest Growth-100 Buffer ETF - March |
First Trust |
03/22/2021 |
Equity |
$ 9,207,040 |
YMAR |
FT Cboe Vest International Equity Buffer ETF - March |
First Trust |
03/22/2021 |
Equity |
$ 3,034,915 |
UMI |
USCF Midstream Energy Income Fund ETF |
USCF |
03/24/2021 |
Equity |
$ 41,860,500 |
ADIV |
SmartETFs Asia Pacific Dividend Builder ETF |
Guinness Atkinson |
03/29/2021 |
Equity |
$ 4,422,420 |
DIVS |
SmartETFs Dividend Builder ETF |
Guinness Atkinson |
03/29/2021 |
Equity |
$ 23,595,561 |
ARKX |
ARK Space Exploration & Innovation ETF |
ARK |
03/29/2021 |
Equity |
$ 352,333,500 |
APRZ |
TrueShares Structured Outcome (April) ETF |
TrueMark Investments |
03/29/2021 |
Equity |
$ 1,250,000 |
PSCW |
Pacer Swan SOS Conservative (April) ETF |
Pacer Advisors |
03/30/2021 |
Equity |
$ 1,000,000 |
JHCB |
John Hancock Corporate Bond ETF |
John Hancock |
03/31/2021 |
Fixed Income |
$ 20,192,640 |
Total |
24 New Active ETFs |
|
|
|
$ 789,545,545.96 |
Source: Factset as of 3/31/2021
NYSE ETF Summit & ETF Issuer Insights
Looking to learn more about the ETF market? Join the NYSE’s upcoming ETF Summit or visit HomeofETFs.com to catch up on insights from across the market.