Opportunity in the Active ETF Market
January 29, 2021
Semi-Transparent ETFs Collectively Cross $1 Billion in Assets
On Jan. 12, the quickly expanding semi-transparent market, which is currently comprised of 19 ETFs, collectively closed with over $1 billion in assets under management (AUM). It took just 286 calendar days for the semi-transparent marketplace to reach this milestone. For perspective, 2,371 calendar days passed before active transparent domestic equity ETFs reached the same threshold back in 2013.
SEC Publishes Notice of NYSE Filing to Obtain Additional Basket Flexibility for Active Managers
On Jan. 12, the SEC published notice of the NYSE and Natixis Investment Manager’s amended exemptive relief filing to allow for additional basket flexibility within the NYSE’s active, semi-transparent ETF structure. Once formally approved, future asset managers using the NYSE model will be able to construct creation/redemption baskets that differ from the daily tracking basket and proxy portfolio, much like transparent ETFs that fall under the ETF Rule do today. This will further enhance the operational efficiency of the NYSE model, increase tax efficiency and provide for reduced costs for asset managers. The SEC Notice can be found here.
Spotlight on Semi-Transparent ETFs
A lot has happened since the first two semi-transparent ETFs launched in April 2020. The sector has accumulated nearly $1.1 billion in AUM across 19 ETFs from seven different asset managers. Despite current relief exclusively permitting domestic equity strategies, the market is comprised of a diverse set of investment objectives including: ESG, Value, Growth, Dividend, Multi-Cap and Single Cap (Large & Mid) investment strategies. As of Jan. 22, first-mover American Century leads the industry in assets, with over $531 million year-to-date. Fidelity sponsors the largest ETF: the $230 million Fidelity Blue Chip Growth ETF (FBCG). FBCG is joined by three other ETFs from American Century that have already eclipsed $100 million in assets. Collectively, these four ETFs now account for 71.67% of assets.
The Growth of Active ETFs
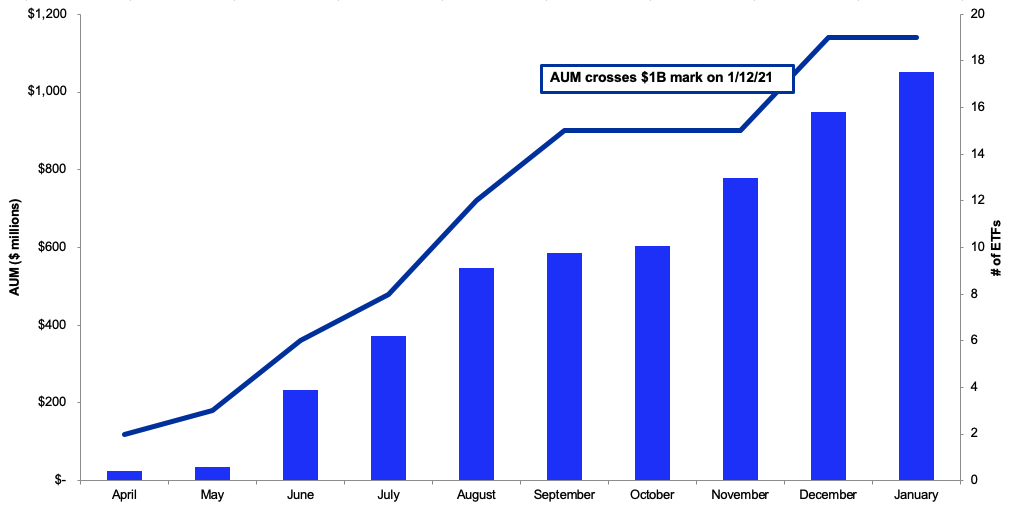
Source FactSet as of 1/21/2021
Ahead of the first semi-transparent ETF launch, market participants wondered how efficiently liquidity providers would be able to make markets while managing a variety of structures and a lack of transparency. The answer? Quite well. Spreads have been similar to, and in some cases tighter than, comparable active transparent ETFs. According to a recent Quick Take note from Jane Street, average daily bid-ask spreads for the 19 ETFs ranged from 7.5 to 26.4 basis points (bps) with an average of 15.7 bps and median of 15.1 bps. Meanwhile, average spreads for the 139 transparent active equity ETFs that launched in 2020 ranged from 4 to 110 bps, with a median spread of 25 bps.
Semi-Transparent ETF Spreads
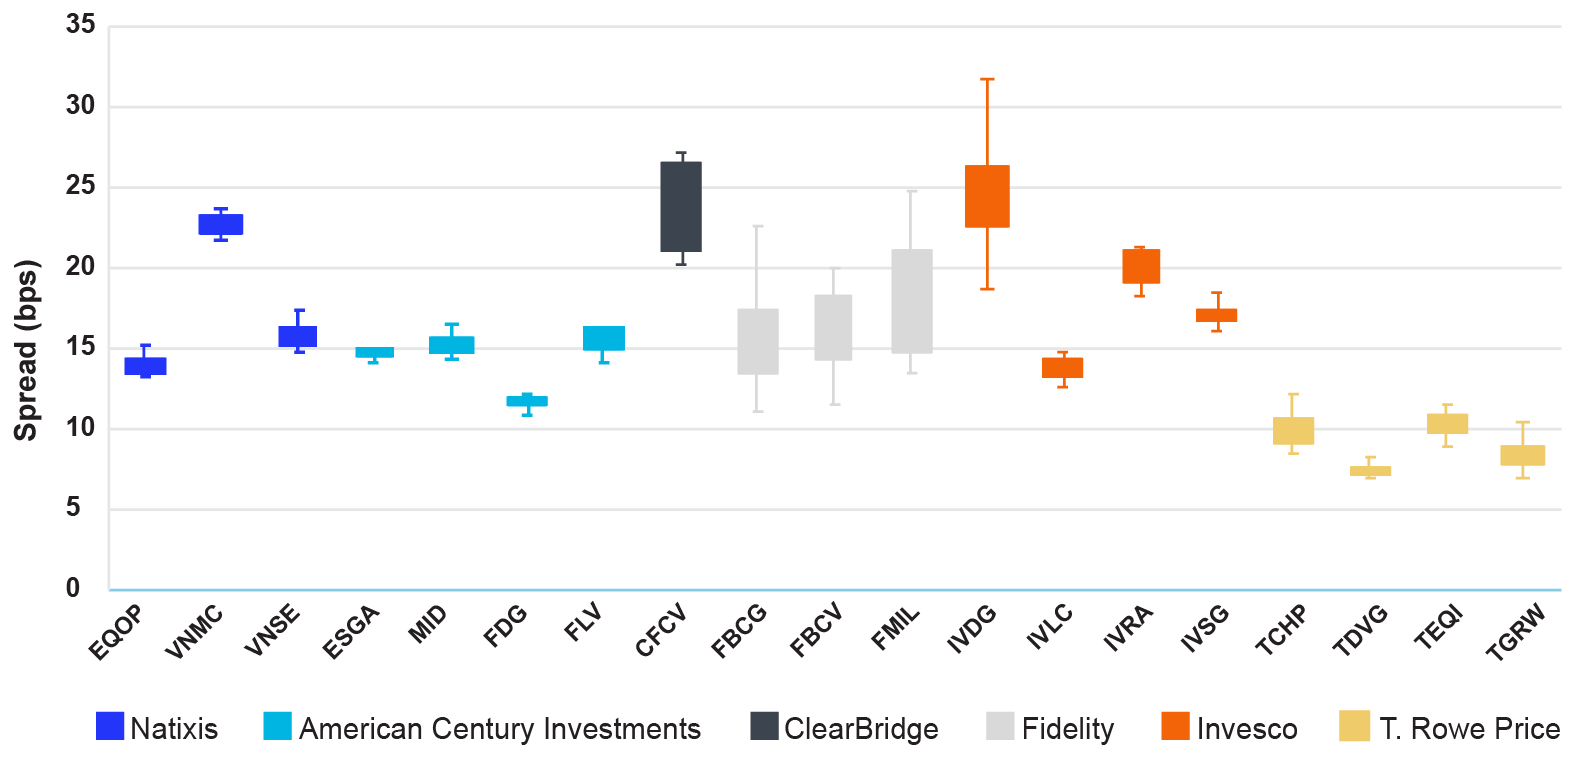
Source: NYSE Consolidated tape 12/22/2020 - 1/22/2021
Secondary market volumes have grown month-over-month since April 2020, with shares traded and dollars traded averaging 452,880 and $14.34 million respectively year-to-date. Three of American Century’s funds (FDG, ESGA and FLV) have traded over 1 million shares in a single trading day, with over 1.8 million shares of FDG setting the high watermark for the space on June 4, 2020. Despite concentrated volume in a few names, market quality has remained consistently strong across issuers and solutions.
Semi-Transparent ETF Volumes
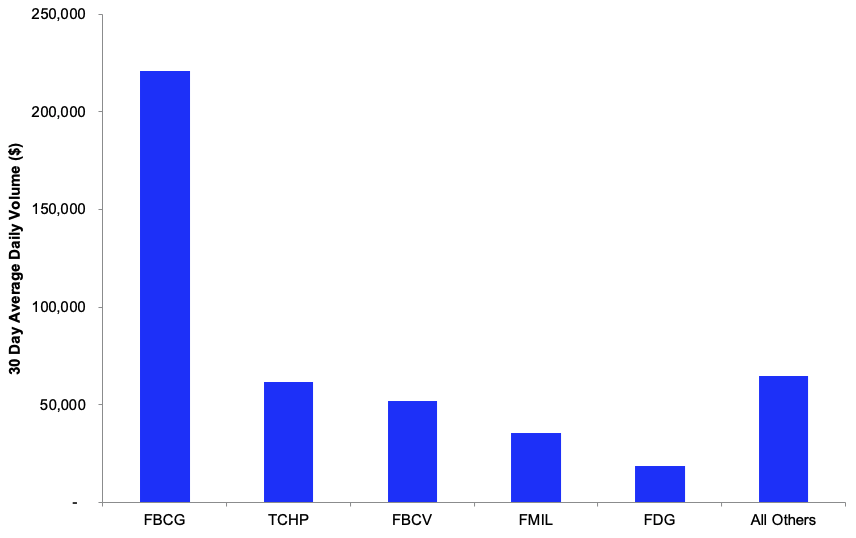
Source: NYSE Consolidated tape 12/22/2020 - 1/22/2021
Additional Reading on the Active ETF Market
- Foreside’s “The Expanded ETF Ecosystem- Transparent & Semi-Transparent ETFs”: Foreside, with Arro Financial Communications, created a guide to understanding the expanded ETF ecosystem, encompassing both traditional passive ETFs and new semi-transparent models.
- Janus Henderson’s blog, “Active ETFs Are Here to Stay”: Discusses the driving forces behind the growth of ETFs and why active ETFs are capturing a large share of the overall market.
Active ETF Stat Pack
| Firms | |||
| # of Issuers | 94 | ||
| # of New Issuers 2021 | 1 | ||
| Products | Assets | ||
| # of ETFs | 489 | AUM ($B) | $191.21 |
| # of New Launches 2021 | 16 | 3 Yr AUM CAGR | 161% |
| Avg. ER | 0.55% | 5 Yr AUM CAGR | 56% |
| Cash Flow | Trading | ||
| YTD Cash Flow ($B) | $12.7 | YTD ADV (Shares) | 50,088,126 |
| 3 Yr Cash Flow | $124.1 | YTD ADV ($) | $3.72 B |
| 5 Yr Cash Flow | $146.5 | YTD Avg. Spread (bps)* | 30.30 |
Active, Semi-Transparent Update
Ticker |
Inception |
Name |
AUM |
Flows |
Avg. Spread (bps) |
ADV (shares) |
Structure |
LMM |
Expense Ratio |
|---|---|---|---|---|---|---|---|---|---|
Ticker |
Inception |
Name |
AUM |
YTD Flows |
Avg. Spread (bps) |
ADV (shares) |
Structure |
LMM |
Expense Ratio |
EQOP |
09/17/2020 |
Natixis U.S. Equity Opportunities ETF |
$12,220,349 |
$ - |
13.89 |
27 |
NYSE AMS |
Citadel |
0.90% |
VNSE |
09/17/2020 |
Natixis Vaughan Nelson Select ETF |
$6,229,209 |
$ - |
15.77 |
7 |
NYSE AMS |
Citadel |
0.90% |
VNMC |
09/17/2020 |
Natixis Vaughan Nelson Mid Cap ETF |
$8,048,730 |
$ - |
23.08 |
967 |
NYSE AMS |
Citadel |
0.85% |
ESGA |
07/15/2020 |
American Century Sustainable Equity ETF |
$120,120,536 |
$7,150,365 |
15.01 |
15,742 |
NYSE AMS |
Citadel |
0.39% |
MID |
07/15/2020 |
American Century Mid Cap Growth Impact ETF |
$8,759,200 |
$539,689 |
15.06 |
1,134 |
NYSE AMS |
Citadel |
0.45% |
FDG |
04/02/2020 |
American Century Focused Dynamic Growth ETF |
$226,146,270 |
$ - |
11.79 |
18,565 |
ActiveShares |
Citadel |
0.45% |
FLV |
04/02/2020 |
American Century Focused Large Cap Value ETF |
$176,462,172 |
$3,841,735 |
15.84 |
9,420 |
ActiveShares |
Citadel |
0.42% |
CFCV |
05/28/2020 |
ClearBridge Focus Value ETF |
$3,218,715 |
$180 |
26.37 |
- |
ActiveShares |
GTS |
0.50% |
FBCG |
06/04/2020 |
Fidelity Blue Chip Growth ETF |
$230,266,613 |
$22,709,505 |
14.93 |
221,105 |
Fidelity Proxy |
GTS |
0.59% |
FBCV |
06/04/2020 |
Fidelity Blue Chip Value ETF |
$51,288,745 |
$6,867,500 |
16.13 |
51,647 |
Fidelity Proxy |
GTS |
0.59% |
FMIL |
06/04/2020 |
Fidelity New Millennium ETF |
$29,774,735 |
$6,935,095 |
18.46 |
35,478 |
Fidelity Proxy |
GTS |
0.59% |
TCHP |
08/05/2020 |
T. Rowe Price Blue Chip Growth ETF |
$78,914,707 |
$13,749,825 |
10.01 |
61,444 |
T Rowe Proxy |
Virtu |
0.57% |
TDVG |
08/05/2020 |
T. Rowe Price Dividend Growth ETF |
$39,422,539 |
$2,272,282 |
7.53 |
11,617 |
T Rowe Proxy |
RBC |
0.50% |
TEQI |
08/05/2020 |
T. Rowe Price Equity Income ETF |
$26,339,387 |
$2,413,064 |
9.93 |
8,352 |
T Rowe Proxy |
Virtu |
0.54% |
TGRW |
08/05/2020 |
T. Rowe Price Growth Stock ETF |
$28,493,485 |
$1,593,760 |
8.49 |
10,275 |
T Rowe Proxy |
RBC |
0.52% |
IVDG |
12/22/2020 |
Invesco Focused Discovery Growth ETF |
$1,253,000 |
$ - |
25.5 |
3,040 |
Invesco Model |
Citadel |
0.59% |
IVLC |
12/22/2020 |
Invesco US Large Cap Core ESG ETF |
$1,233,000 |
$ - |
13.65 |
1,157 |
Fidelity Proxy |
Citadel |
0.48% |
IVRA |
12/22/2020 |
Invesco Real Assets ESG ETF |
$1,206,000 |
$ - |
19.61 |
1,369 |
Fidelity Proxy |
Citadel |
0.59% |
IVSG |
12/22/2020 |
Invesco Select Growth ETF |
$1,262,000 |
$ - |
17.61 |
1,532 |
Invesco Model |
Citadel |
0.48% |
|
|
Total/Average |
$1,050,659,390 |
$68,073,000 |
15.72 |
452,880 |
|
|
0.57% |
Source: Factset & NYSE Internal Database and Consolidated Tape Statistics as of 11/30/2020
*Simple average
January Active ETF Launches
Ticker |
Name |
Issuer |
Launch Date |
Asset Class |
AUM |
|---|---|---|---|---|---|
AZAJ |
AllianzIM U.S. Large Cap Buffer10 Jan ETF |
Allianz |
01/04/2021 |
Equity |
$29,088,905 |
AZBJ |
AllianzIM U.S. Large Cap Buffer20 Jan ETF |
Allianz |
01/04/2021 |
Equity |
$27,670,170 |
JANZ |
TrueShares Structured Outcome (January) ETF |
TrueMark Investments |
01/04/2021 |
Equity |
$3,221,250 |
DBJA |
Innovator Double Stacker 9 Buffer ETF - January |
Innovator |
01/04/2021 |
Equity |
$9,029,895 |
DSJA |
Innovator Double Stacker ETF - January |
Innovator |
01/04/2021 |
Equity |
$2,594,960 |
TSJA |
Innovator Triple Stacker ETF - January |
Innovator |
01/04/2021 |
Equity |
$20,200,375 |
EUCG |
Euclid Capital Growth ETF |
Toroso Investments |
01/05/2021 |
Asset Allocation |
$30,259,644 |
XDAT |
Franklin Exponential Data ETF |
Franklin Templeton |
01/14/2021 |
Equity |
$2,543,000 |
INFL |
Horizon Kinetics Inflation Beneficiaries ETF |
Horizon Kinetics LLC |
01/12/2021 |
Equity |
$17,486,000 |
LVOL |
American Century Low Volatility ETF |
American Century Investments |
01/14/2021 |
Equity |
$4,226,901 |
OVLH |
Overlay Shares Hedged Large Cap Equity ETF |
Liquid Strategies |
01/15/2021 |
Equity |
$2,535,000 |
OVT |
Overlay Shares Short Term Bond ETF |
Liquid Strategies |
01/15/2021 |
Fixed Income |
$2,500,000 |
FJAN |
FT Cboe Vest US Equity Buffer ETF - January |
First Trust |
01/19/2021 |
Equity |
$35,194,661 |
DJAN |
FT Cboe Vest U.S. Equity Deep Buffer ETF - January |
First Trust |
01/19/2021 |
Equity |
$18,192,661 |
BUFD |
FT Cboe Vest Fund of Deep Buffer ETF |
First Trust |
01/21/2021 |
Equity |
$2,005,840 |
BGLD |
FT Cboe Vest Gold Strategy Quarterly Buffer ETF |
First Trust |
01/21/2021 |
Commodities |
$2,000,240 |
Total |
16 New Actively Managed ETFs |
|
|
|
$208,749,502 |
Source: Factset & NYSE Internal Database and Consolidated Tape Statistics as of 1/22/2021
*Simple average
NYSE ETF Summit & Active ETF Webinar Series Replay
Missed the NYSE ETF Summit or our Active ETF Webinar series?
Visit HomeofETFs.com to catch-up
Hear from ETF experts from each of the various active ETF structure providers, fund sponsors such as American Century, Fidelity, PIMCO and T. Rowe Price, liquidity providers such as Flow Traders and Jane Street, and service providers such as BNY Mellon and State Street.
NYSE ETF Education Series
Join the NYSE ETF Team and industry experts in our series of educational webcasts. sign up by emailing us at [email protected]
Visit HomeofETFs.com to catch-up on past webinars