December 10, 2020
Active ETF Filings Accelerate to New Highs
2020 has been a banner year for the active ETF industry. At the New York Stock Exchange, we expect this trend to continue throughout 2021. A recent internal analysis revealed that over 130 active ETF registration statements have been submitted to the SEC since the end of Q2 2020. During the fourth quarter alone, 73 actively managed ETF filings have been made. This includes the first two semi-transparent active ETFs using Blue Tractor’s Shielded Alpha structure.
Dimensional Funds Enters the ETF Market and Follows Guiness Atkinson in Plans to Convert Legacy Mutual Funds into ETFs
Dimensional Funds joins NYSE-listed ETF issuer Guinness Atkinson in seeking to convert existing mutual funds to ETFs. The conversion -- coupled with the recent launch of active ETFs DFAU, DFAI and DFAE on NYSE Arca -- would make Dimensional Funds one of the largest active ETF sponsors by assets under management (AUM). The full press release can be found here.
Earlier this year, Guinness Atkinson announced the planned conversion of two mutual funds -- Guinness Atkinson Asia Pacific Dividend Builder Fund & Guinness Atkinson Dividend Builder Fund -- into two new ETFs under its NYSE-listed SmartETF brand. Details on the conversion can be found here.
The New York Stock Exchange Receives Approval to List Semi-Transaprent ETFs on the NYSE Floor
On Dec. 1, the NYSE received regulatory approval to list active, semi-transparent ETFs on the Floor of the Exchange. Listing on the NYSE would provide active managers access to our unique floor model, which combines human oversight and accountability via Designated Market Makers with world-class technology. We're excited by this important next step to be able to list ETFs directly on the iconic NYSE Floor. We look forward to bringing you updates as we move closer to the first launch.
Precidian Joins the NYSE in Seeking Additional Basket Flexibility for Active Managers
On Nov. 27, Precidian amended their exemptive relief filing with the SEC to allow for additional basket flexibility within their active ETF model. The NYSE, Fidelity and Blue Tractor all have previously filed, as we shared in our last update. If approved, future asset managers using the Precidian ActiveShares model will be able to construct creation/redemption baskets (“custom baskets”) that differ from the actual portfolio. This would improve the operational efficiency of the structure and potentially reduce costs for sponsors. The full filings for each sponsor are available here: NYSE, Blue Tractor, Fidelity, and Precidian.
Spotlight: November 2020
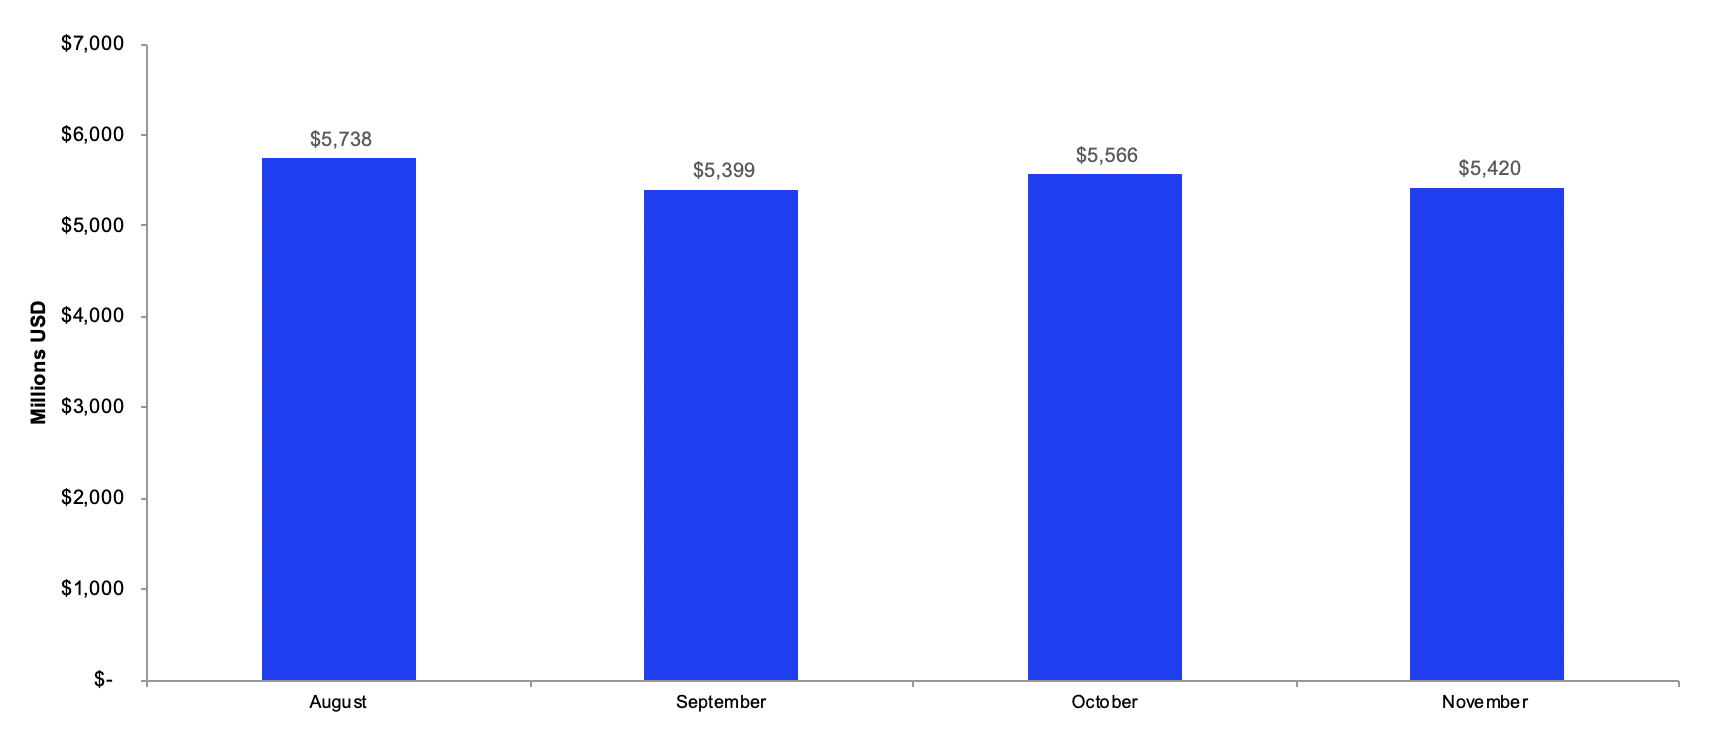
November was another month of growth and inflows for the active ETF market. There was$5.4 billion in new cash flow for the month, and year-to-date cash flow is now $47 billion.AUM now totals $155 billion.
Active ETF Fund Flows By Month
Market growth was again led by thematic Equity ETF strategies, ultra/short-term Fixed Income strategies, and renewed interest in higher-yielding senior loan, core bond and preferred securities.
Active ETF Fund Flows By Asset Class
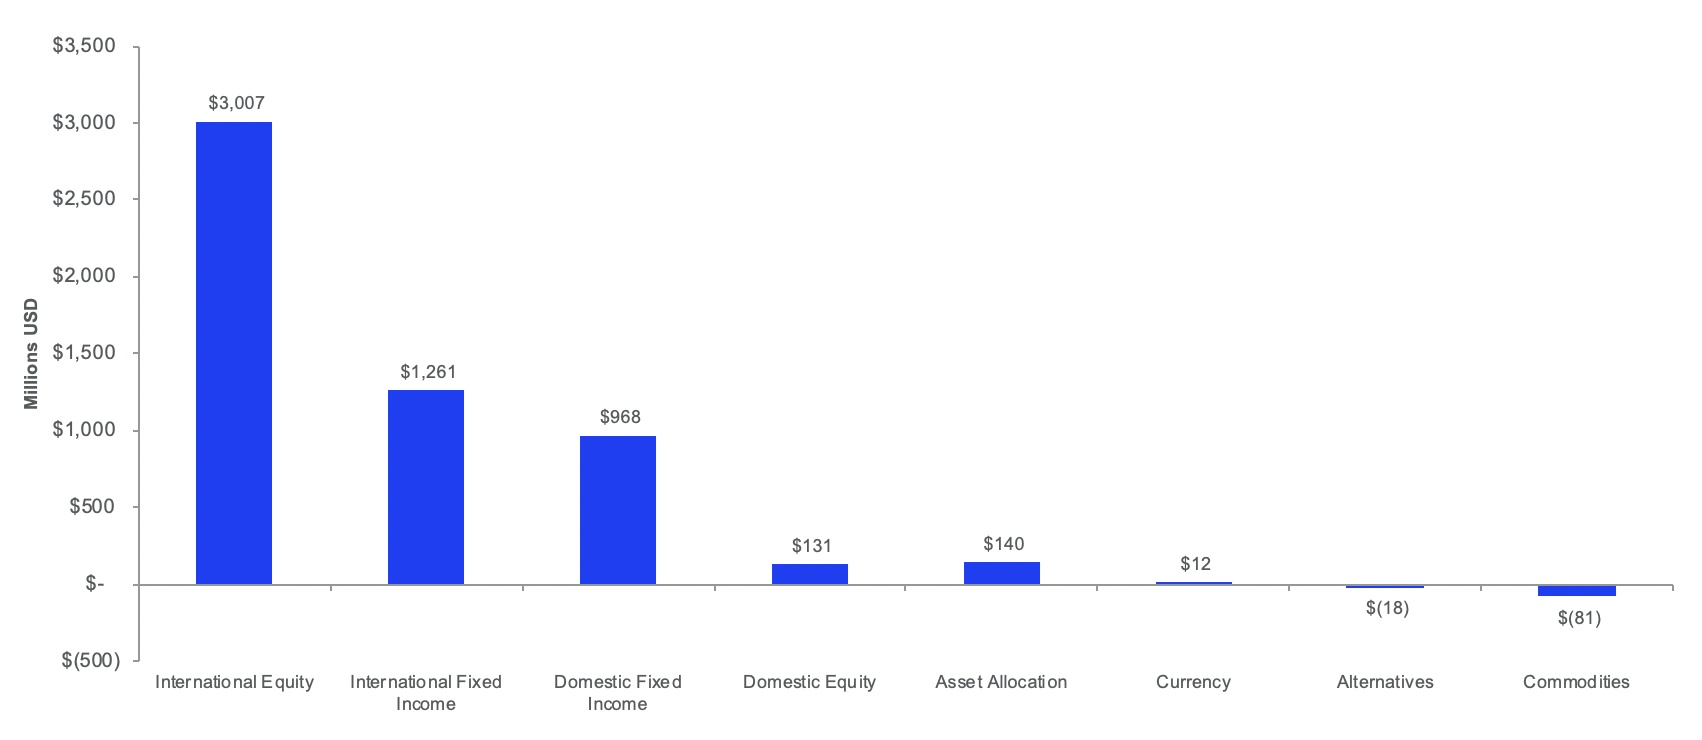
Source: Factset as of 11/30/2020
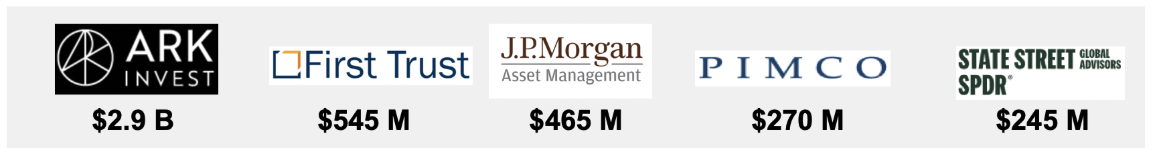
At the issuer level, ARK Invest surpassed a record month in October ($2.1 billion) with $2.9 billion in cash flow across its five thematic ETFs during November. Its success was well distributed yet again, with all five of the firm’s ETFs making the industry’s top 10 cash flow list this month. Outside of ARK, American Century ($126 million), Amplify ($84 million), AdvisorShares ($83 million) and LeaderShares ($81 million) led Equity inflows. Market leaders First Trust ($658 million), J.P. Morgan ($438 million) and PIMCO ($269 million) drove Fixed Income growth during the month, with support from State Street ($253 million). Other notable contributions across all asset classes came from Fidelity ($178 million), Quadratic ($162 million), and newcomer Simplify ($62 million).
During the month, 51 issuers, representing 61% of all active ETF issuers, experienced positive cash flows across their lineup. Year-to-date, 67 issuers (81%) have experienced net inflows. For the month, 202 active ETFs (46%) experienced positive cash flow compared to 310 (71%) year-to date. 27 active ETFs (6%) have surpassed the $1 billion mark and 155 (35%) have passed the $100 million mark.
Top 5 Issuers by Cash Flow November 2020
Top 10 ETFs by Cash Flow ($M) | ||
|---|---|---|
ARKK |
ARK Innovation |
1,246.0 |
ARKW |
ARK Next Generation Internet |
617.5 |
ARKG |
ARK Genomic Revolution |
599.2 |
FIXD |
First Trust TCW Opp. Fixed Income |
261.6 |
JPST |
JPMorgan Ultra-Short Income |
241.1 |
ARKF |
ARK Fintech Innovation |
232.9 |
SRLN |
SPDR Blackstone / GSO Senior Loan |
213.0 |
ARKQ |
ARK Autonomous Technology & Robotics |
204.8 |
VNLA |
Janus Henderson Short Duration Income |
163.9 |
IVOL |
Quadratic Interest Rate Vol. & Infl. Hedge |
161.6 |
|
Top 10 Total Cash Flow |
3,942.0 |
Bottom 10 ETFs by Cash Flow ($M) | ||
|---|---|---|
PDBC |
Invesco Opt. Yld. Divers, Commodity Strategy |
(125.3) |
KJAN |
Innovator Russell 2000 Power Buffer - Jan. |
(119.8) |
FLCB |
Franklin Liberty U.S. Core Bond |
(102.2) |
NEAR |
iShares Short Maturity Bond |
(77.7) |
FTSM |
First Trust Enhanced Short Maturity |
(72.1) |
DFEB |
FT Cboe Vest U.S. Equity Deep Buffer - Feb. |
(63.5) |
PJAN |
Innovator S&P 500 Power Buffer - Jan. |
(54.2) |
EMLP |
First Trust North American Energy Infrastructure |
(49.9) |
HOLD |
AdvisorShares Sage Core Reserves |
(44.5) |
BJAN |
Innovator S&P 500 Buffer - Jan. |
(43.0) |
|
Bottom 10 Total Cash Flow |
(752.1) |
Active ETF Stat Pack
| Firms | |||
| # of Issuers | 86 | ||
| # of New Issuers 2020 | 24 | ||
| Products | Assets | ||
| # of ETFs | 439 | AUM ($B) | $155.51 |
| # of New Launches 2020 | 131 | 3 Yr AUM CAGR | 154% |
| Avg. ER | 0.50% | 5 Yr AUM CAGR | 51% |
| Cash Flow | Trading | ||
| YTD Cash Flow ($B) | $46.9 | YTD ADV (Shares) | 36,334,903 |
| 3 Yr Cash Flow | $101.9 | YTD ADV ($) | $1.50 B |
| 5 Yr Cash Flow | $123.5 | YTD Avg. Spread (bps)* | 39.77 |
Source: Factset & NYSE Internal Database and Consolidated Tape Statistics as of 11/30/2020
*Simple average
Active, Semi-Transparent Update
Ticker |
Inception |
Name |
AUM |
Flows |
Avg. Spread (bps) |
ADV (shares) |
Structure |
LMM |
Expense Ratio |
|---|---|---|---|---|---|---|---|---|---|
EQOP |
09/17/2020 |
Natixis U.S. Equity Opportunities ETF |
$11,489,976 |
$240,299 |
14.81 |
7,983 |
NYSE AMS |
Citadel |
0.90% |
VNSE |
09/17/2020 |
Natixis Vaughan Nelson Select ETF |
$5,582,669 |
$ - |
15.72 |
4,248 |
NYSE AMS |
Citadel |
0.90% |
VNMC |
09/17/2020 |
Natixis Vaughan Nelson Mid Cap ETF |
$6,666,762 |
$779,943 |
23.3 |
4,820 |
NYSE AMS |
Citadel |
0.85% |
ESGA |
09/15/2020 |
American Century Sustainable Equity ETF |
$102,088,731 |
$87,638,555 |
15.06 |
25,365 |
NYSE AMS |
Citadel |
0.39% |
MID |
09/15/2020 |
American Century Mid Cap Growth Impact ETF |
$7,222,920 |
$1,985,690 |
15.14 |
- |
NYSE AMS |
Citadel |
0.45% |
FDG |
04/02/2020 |
American Century Focused Dynamic Growth ETF |
$197,983,800 |
$145,059,043 |
15.32 |
42,230 |
ActiveShares |
Citadel |
0.45% |
FLV |
04/02/2020 |
American Century Focused Large Cap Value ETF |
$137,947,491 |
$117,048,934 |
16.83 |
19,276 |
ActiveShares |
Citadel |
0.42% |
CFCV |
05/28/2020 |
ClearBridge Focus Value ETF |
$3,134,930 |
($608) |
34.1 |
967 |
ActiveShares |
GTS |
0.50% |
FBCG |
06/04/2020 |
Fidelity Blue Chip Growth ETF |
$142,631,475 |
$125,563,688 |
21.74 |
137,376 |
Fidelity Proxy |
GTS |
0.59% |
FBCV |
06/04/2020 |
Fidelity Blue Chip Value ETF |
$27,184,275 |
$22,985,513 |
26.71 |
31,901 |
Fidelity Proxy |
GTS |
0.59% |
FMIL |
06/04/2020 |
Fidelity New Millennium ETF |
$14,795,563 |
$11,129,220 |
26.03 |
17,136 |
Fidelity Proxy |
GTS |
0.59% |
TCHP |
08/05/2020 |
T. Rowe Price Blue Chip Growth ETF |
$48,541,797 |
$30,744,079 |
10.08 |
30,331 |
T Rowe Proxy |
Virtu |
0.57% |
TDVG |
08/05/2020 |
T. Rowe Price Dividend Growth ETF |
$28,480,499 |
$11,247,841 |
6.75 |
8,870 |
T Rowe Proxy |
RBC |
0.50% |
TEQI |
08/05/2020 |
T. Rowe Price Equity Income ETF |
$21,935,815 |
$4,190,757 |
9.85 |
4,924 |
T Rowe Proxy |
Virtu |
0.54% |
TGRW |
08/05/2020 |
T. Rowe Price Growth Stock ETF |
$23,551,741 |
$6,007,993 |
7.72 |
6,247 |
T Rowe Proxy |
RBC |
0.52% |
|
|
Total/Average |
$779,238,445 |
$564,620,945 |
17.28 |
341,674 |
|
|
0.58% |
Source: Factset & NYSE Internal Database and Consolidated Tape Statistics as of 11/30/2020
*Simple average
November Active ETF Launches
Ticker |
Name |
Issuer |
Launch Date |
Asset Class |
AUM |
|---|---|---|---|---|---|
NVMZ |
TrueShares Structured Outcome (November) ETF |
TrueMark Investments |
11/03/2020 |
Equity |
$2,695,670 |
CBLS |
Changebridge Capital Long/Short Equity ETF |
Changebridge Capital LLC |
11/13/2020 |
Alternatives |
$2,144,870 |
CBSE |
Changebridge Capital Sustainable Equity ETF |
Changebridge Capital LLC |
11/13/2020 |
Equity |
$1,519,602 |
LBAY |
Leatherback Long/Short Alternative Yield ETF |
Toroso Investments |
11/17/2020 |
Alternatives |
$2,515,575 |
DFAU |
Dimensional US Core Equity Market ETF |
Dimensional Holdings |
11/18/2020 |
Equity |
$105,770,751 |
DFAI |
Dimensional International Core Equity Market ETF |
Dimensional Holdings |
11/18/2020 |
Equity |
$25,356,164 |
RORO |
ATAC US Rotation ETF |
Toroso Investments |
11/18/2020 |
Asset Allocation |
$5,153,250 |
JOET |
Virtus Terranova U.S. Quality Momentum ETF |
Virtus Investment Partners |
11/18/2020 |
Equity |
$79,351,751 |
EGIS |
2ndVote Society Defended ETF |
2nd Vote Value Investments, Inc |
11/18/2020 |
Equity |
$2,580,470 |
LYFE |
2ndVote Life Neutral Plus ETF |
2nd Vote Value Investments, Inc |
11/18/2020 |
Equity |
$2,542,680 |
Total |
10 New Active ETFs |
|
|
|
$229,630,783 |
Source: Factset as of 11/30/2020
NYSE ETF Summit & Active ETF Webinar Series Replay
Missed the NYSE ETF Summit or our Active ETF Webinar series?
Visit HomeofETFs.com to catch-up
Hear from ETF experts from each of the various active ETF structure providers, fund sponsors such as American Century, Fidelity, PIMCO and T. Rowe Price, liquidity providers such as Flow Traders and Jane Street, and service providers such as BNY Mellon and State Street.