
| Ticker | Name | Weight | Exchange |
|---|---|---|---|
| NVDA | NVIDIA Corporation | 9.55% | NASDAQ |
| AAPL | Apple Inc. | 9.53% | NASDAQ |
| MSFT | Microsoft Corporation | 8.34% | NASDAQ |
| AMZN | Amazon.com, Inc. | 5.23% | NASDAQ |
| AVGO | Broadcom Inc. | 4.32% | NASDAQ |
| GOOGL | Alphabet Inc. Class A | 4.30% | NASDAQ |
| GOOG | Alphabet Inc. Class C | 3.72% | NASDAQ |
| TSM | Taiwan Semiconductor Manufacturing Co., Ltd. Sponsored ADR | 3.72% | NYSE |
| META | Meta Platforms Inc Class A | 3.72% | NASDAQ |
| TSLA | Tesla, Inc. | 3.72% | NASDAQ |
| V | Visa Inc. Class A | 2.49% | NYSE |
| NFLX | Netflix, Inc. | 2.00% | NASDAQ |
| MA | Mastercard Incorporated Class A | 1.99% | NYSE |
| ASML | ASML Holding NV Sponsored ADR | 1.82% | NASDAQ |
| BABA | Alibaba Group Holding Limited Sponsored ADR | 1.66% | NYSE |
| PLTR | Palantir Technologies Inc. Class A | 1.62% | NASDAQ |
| AMD | Advanced Micro Devices, Inc. | 1.56% | NASDAQ |
| ORCL | Oracle Corporation | 1.50% | NYSE |
| CSCO | Cisco Systems, Inc. | 1.34% | NASDAQ |
| SAP | SAP SE Sponsored ADR | 1.31% | NYSE |
| IBM | International Business Machines Corporation | 1.27% | NYSE |
| MU | Micron Technology, Inc. | 1.17% | NASDAQ |
| CRM | Salesforce, Inc. | 0.94% | NYSE |
| AMAT | Applied Materials, Inc. | 0.88% | NASDAQ |
| LRCX | Lam Research Corporation | 0.86% | NASDAQ |
Key features
Multi-sector, more precise representation of technology
Robust yet transparent, simple, data-based methodology
Inclusion of all U.S. exchanges
Quicker path to inclusion for qualifying IPOs
More dynamic index composition
Improved index liquidity and investibility
In-line performance with major benchmarks
Methodology
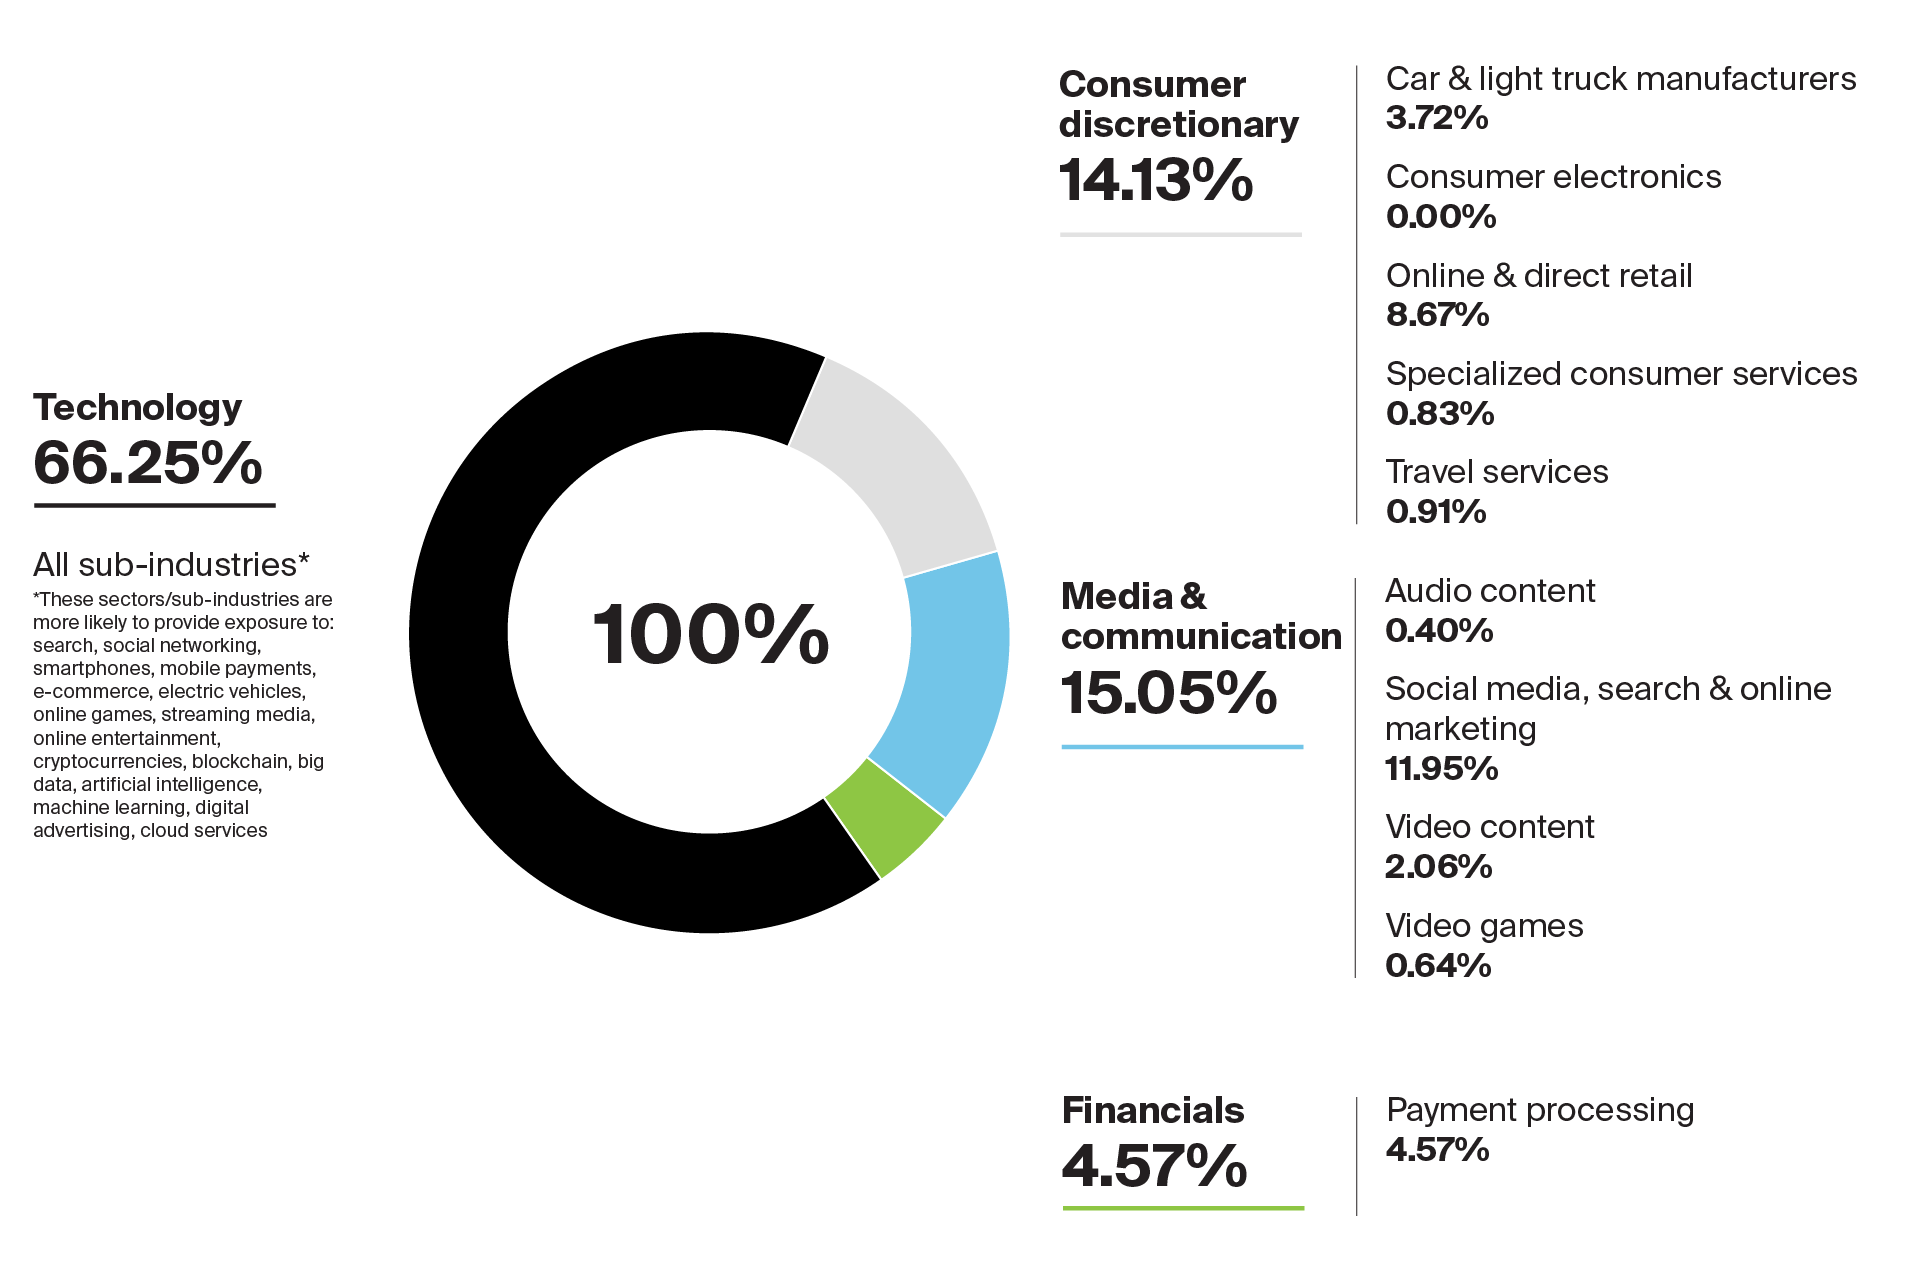
The index is a rules-based, modified float-adjusted market capitalization-weighted equity benchmark designed to track the performance of U.S. listed, actively traded securities of 100 highly-capitalized technology and tech-enabled growth companies across multiple sectors.
Quarterly reconstitution - Close of 3rd Friday of March, June, September, December
Common stocks, ADRs, GDRs
All U.S. exchanges (NYSE, Nasdaq, NYSE American, Cboe BZX, NYSE Arca)
- $1 billion minimum security-level market capitalization
- $5 million three-month average daily traded value (ADTV)
ICE sectors
Ranking, Selection and Weighting
Full company market capitalization (35% weight)
- Largest companies
ADTV across all qualifying securities (35% weight)
- Most liquid companies
Price-to-sales ratio (LTM) (15% weight)
- Reflecting market confidence in future company potential
1-year net sales growth (LTM) (15% weight)
- Fastest recently growing companies
All qualifying securities issued by top 100 ranked companies included in Index
- Security-level, float-adjusted market capitalization
- Simple 4.5% / 20% / 45% capping method
Car & Light Truck Manufacturers
- 'Electric vehicle' keyword filter +25% / 25% / 40% (Price-to-sales) / 10% sales growth
The NYSE 100 Index is one of the most highly correlated indices to technology and related stocks. More dynamic with faster additions to new stocks and quarterly IPOs, it offers smarter exposure to the tech industry.
Active Share
| Statistics | NYSE 100 (TR) | Nasdaq 100 (TR) |
|---|---|---|
| Total return | 1368.25% | 1244.26% |
| Daily sharpe | 0.92 | 0.95 |
| YTD | -0.90% | 0.38% |
| 1Y | 22.86% | 19.82% |
| 3Y (ann.) | 33.05% | 27.30% |
| 5Y (ann.) | 15.16% | 14.48% |
| 10Y (ann.) | 23.74% | 20.89% |
| SInce Incep. (ann.) | 20.15% | 19.43% |