February 3, 2020
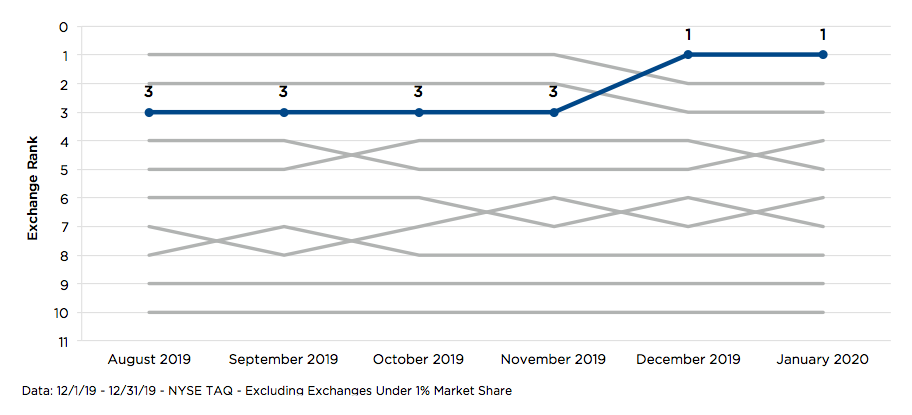
NYSE National One Second Midpoint Quote Stability Rank
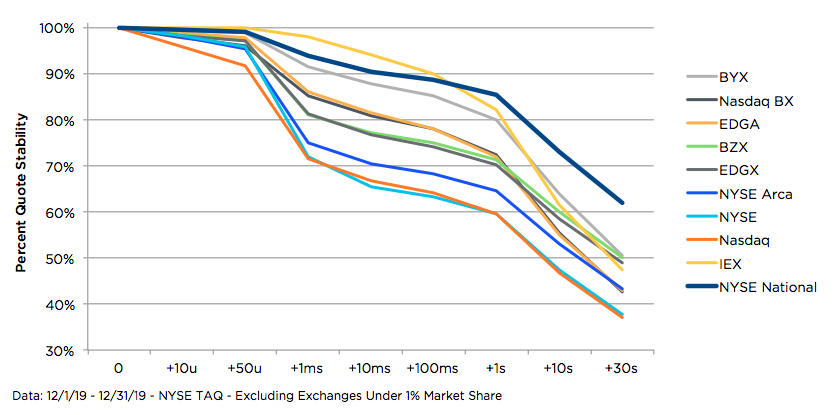
Quote Stability (“QS”) measures movement in the National Best Bid and Offer (NBBO) at various time intervals before and after a trade. QS is represented here as the percentage of traded shares that experience no quote movement at a given time interval. A higher QS value indicates that more trades occur without a related change in market price.
For this analysis, we focus on midpoint trading activity and use the NBBO midpoint as the reference price. Our measurement intervals are from the time of a trade to 30 seconds after the trade, using trades and quotes from the Consolidated Tape (SIP).
QS naturally erodes as more time passes after a trade, as the market is more likely to experience a price change. The chart below shows this trend, up to 30 seconds after trade time. NYSE National is at or near the best QS rate among exchanges throughout this time period.
Midpoint Quote Stability Curve
Increased Liquidity
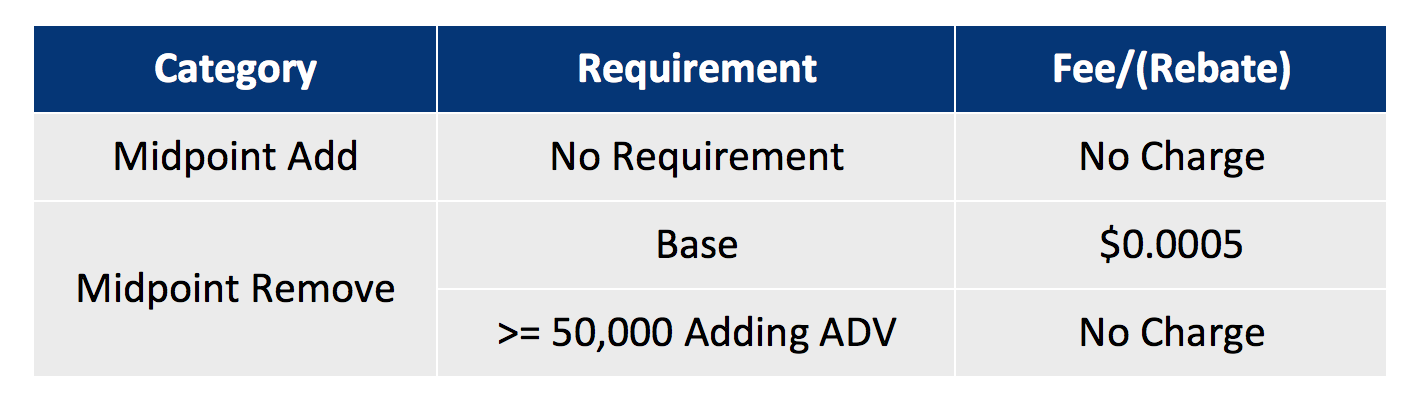
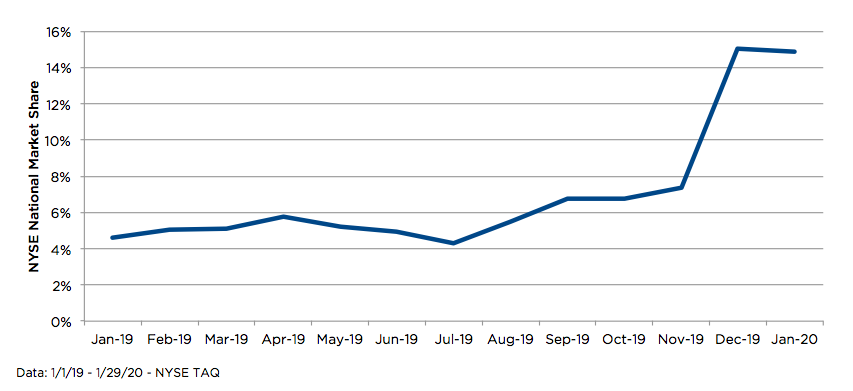
A new midpoint pricing structure on NYSE National increased liquidity and improved QS. The changes, shown below, were implemented in December 2019. In less than one month, NYSE National grew to 15% market share of Taker/Maker Exchange midpoint volume.2
NYSE National Midpoint Pricing
NYSE National Market Share of Taker/Maker Exchange Midpoint Volume
Improved Midpoint Quote Stability
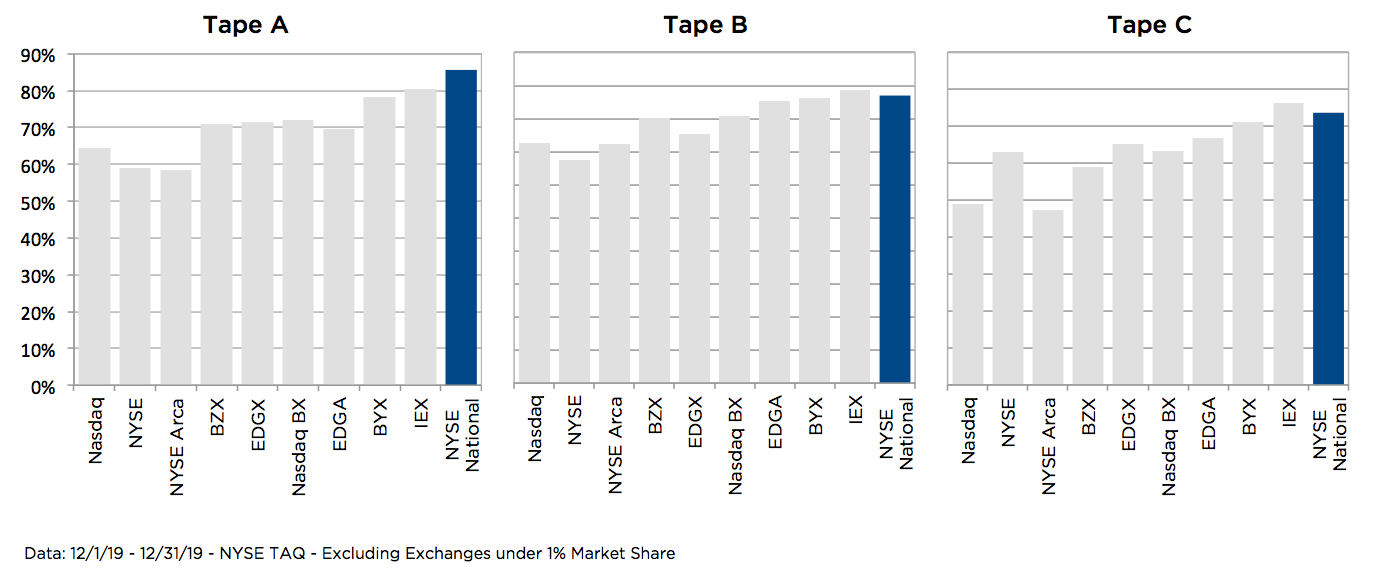
QS describes the post-trade market volatility likely to occur after a fill, which can help inform venue selection. Taker/Maker exchanges typically have higher QS, and NYSE National has consistently been the strongest exchange for overall QS. The midpoint pricing change resulted in further positive improvements to NYSE National’s midpoint QS, putting it ahead of all other exchanges.
One Second Midpoint Quote Stability by Exchange
Opportunity
NYSE National’s midpoint market share growth has improved market quality on the venue. NYSE National is a now key part of any exchange midpoint resting strategy, and offers liquidity removers either price improvement or a rebate up to $0.30 per 100 shares. Reach out to [email protected] for more details.
1Measured at a 1 second after the trade interval, excluding exchanges with <1% market share.
2 Taker/Maker includes NYSE National, CBOE BYX, CBOE EDGA, and Nasdaq BX.
NYSE Research Insights
Find all of NYSE Research's articles on market quality, market structure, auctions, and options.