March 26, 2020
While the NYSE operates in an all-electronic manner temporarily, some Opening and Closing Auctions are executed via an Exchange-run process. These Exchange-facilitated auctions (EFAs) include price collars that limit the auction price to a specified distance from the final reference price.
As our previous post noted, DMMs can electronically open and close securities, and have facilitated well over 90% of the opening and closing auctions this week. When a DMM facilitates an auction, either manually via a human DMM on the Trading Floor or electronically via their algorithms, they are required to include all marketable interest in the auction execution. Auctions that cannot be facilitated electronically by DMM algorithms are currently facilitated by the NYSE’s EFA.
Since these EFAs will only execute up to the collar price, there is a potential that marketable orders (e.g. Market, MOO, MOC, or better-priced limit orders) will not be executed if the EFA is limited by the collar.1 In practice, we find that:
- EFAs are rarely executed at prices subject to the price collar
- Collared EFAs mostly occur in thinly-traded securities
- Collared EFAs result in very few shares remaining unexecuted
NYSE Auctions, March 23-26
Over the first four days of the temporary Trading Floor closure, NYSE securities have had 21,500 Opening and Closing Auctions, over 90% of which have been executed by the DMM. Market order shares have remained unexecuted in fewer than 1% of total auctions.
| Total Auctions | Total Auction Volume | Auctions w/ Cancelled Market Orders | Total Market Order Shares Cancelled | ||
Open |
3/23/20 | 2,882 | 92,789,341 | 26 | 461,833 |
| 3/24/20 | 2,816 | 74,851,458 | 84 | 843,844 | |
| 3/25/20 | 2,805 | 83,645,200 | 57 | 589,203 | |
| 3/26/20 | 2,806 | 55,224,028 | 28 | 326,809 | |
Close |
3/23/20 | 2,545 | 332,859,460 | 3 | 182 |
| 3/24/20 | 2,508 | 469,304,525 | 5 | 10,303 | |
| 3/25/20 | 2,557 | 471,464,384 | 1 | 82 | |
| 3/25/20 | 2,581 | 413,492,584 | 1 | 314 |
Auction Price Movement
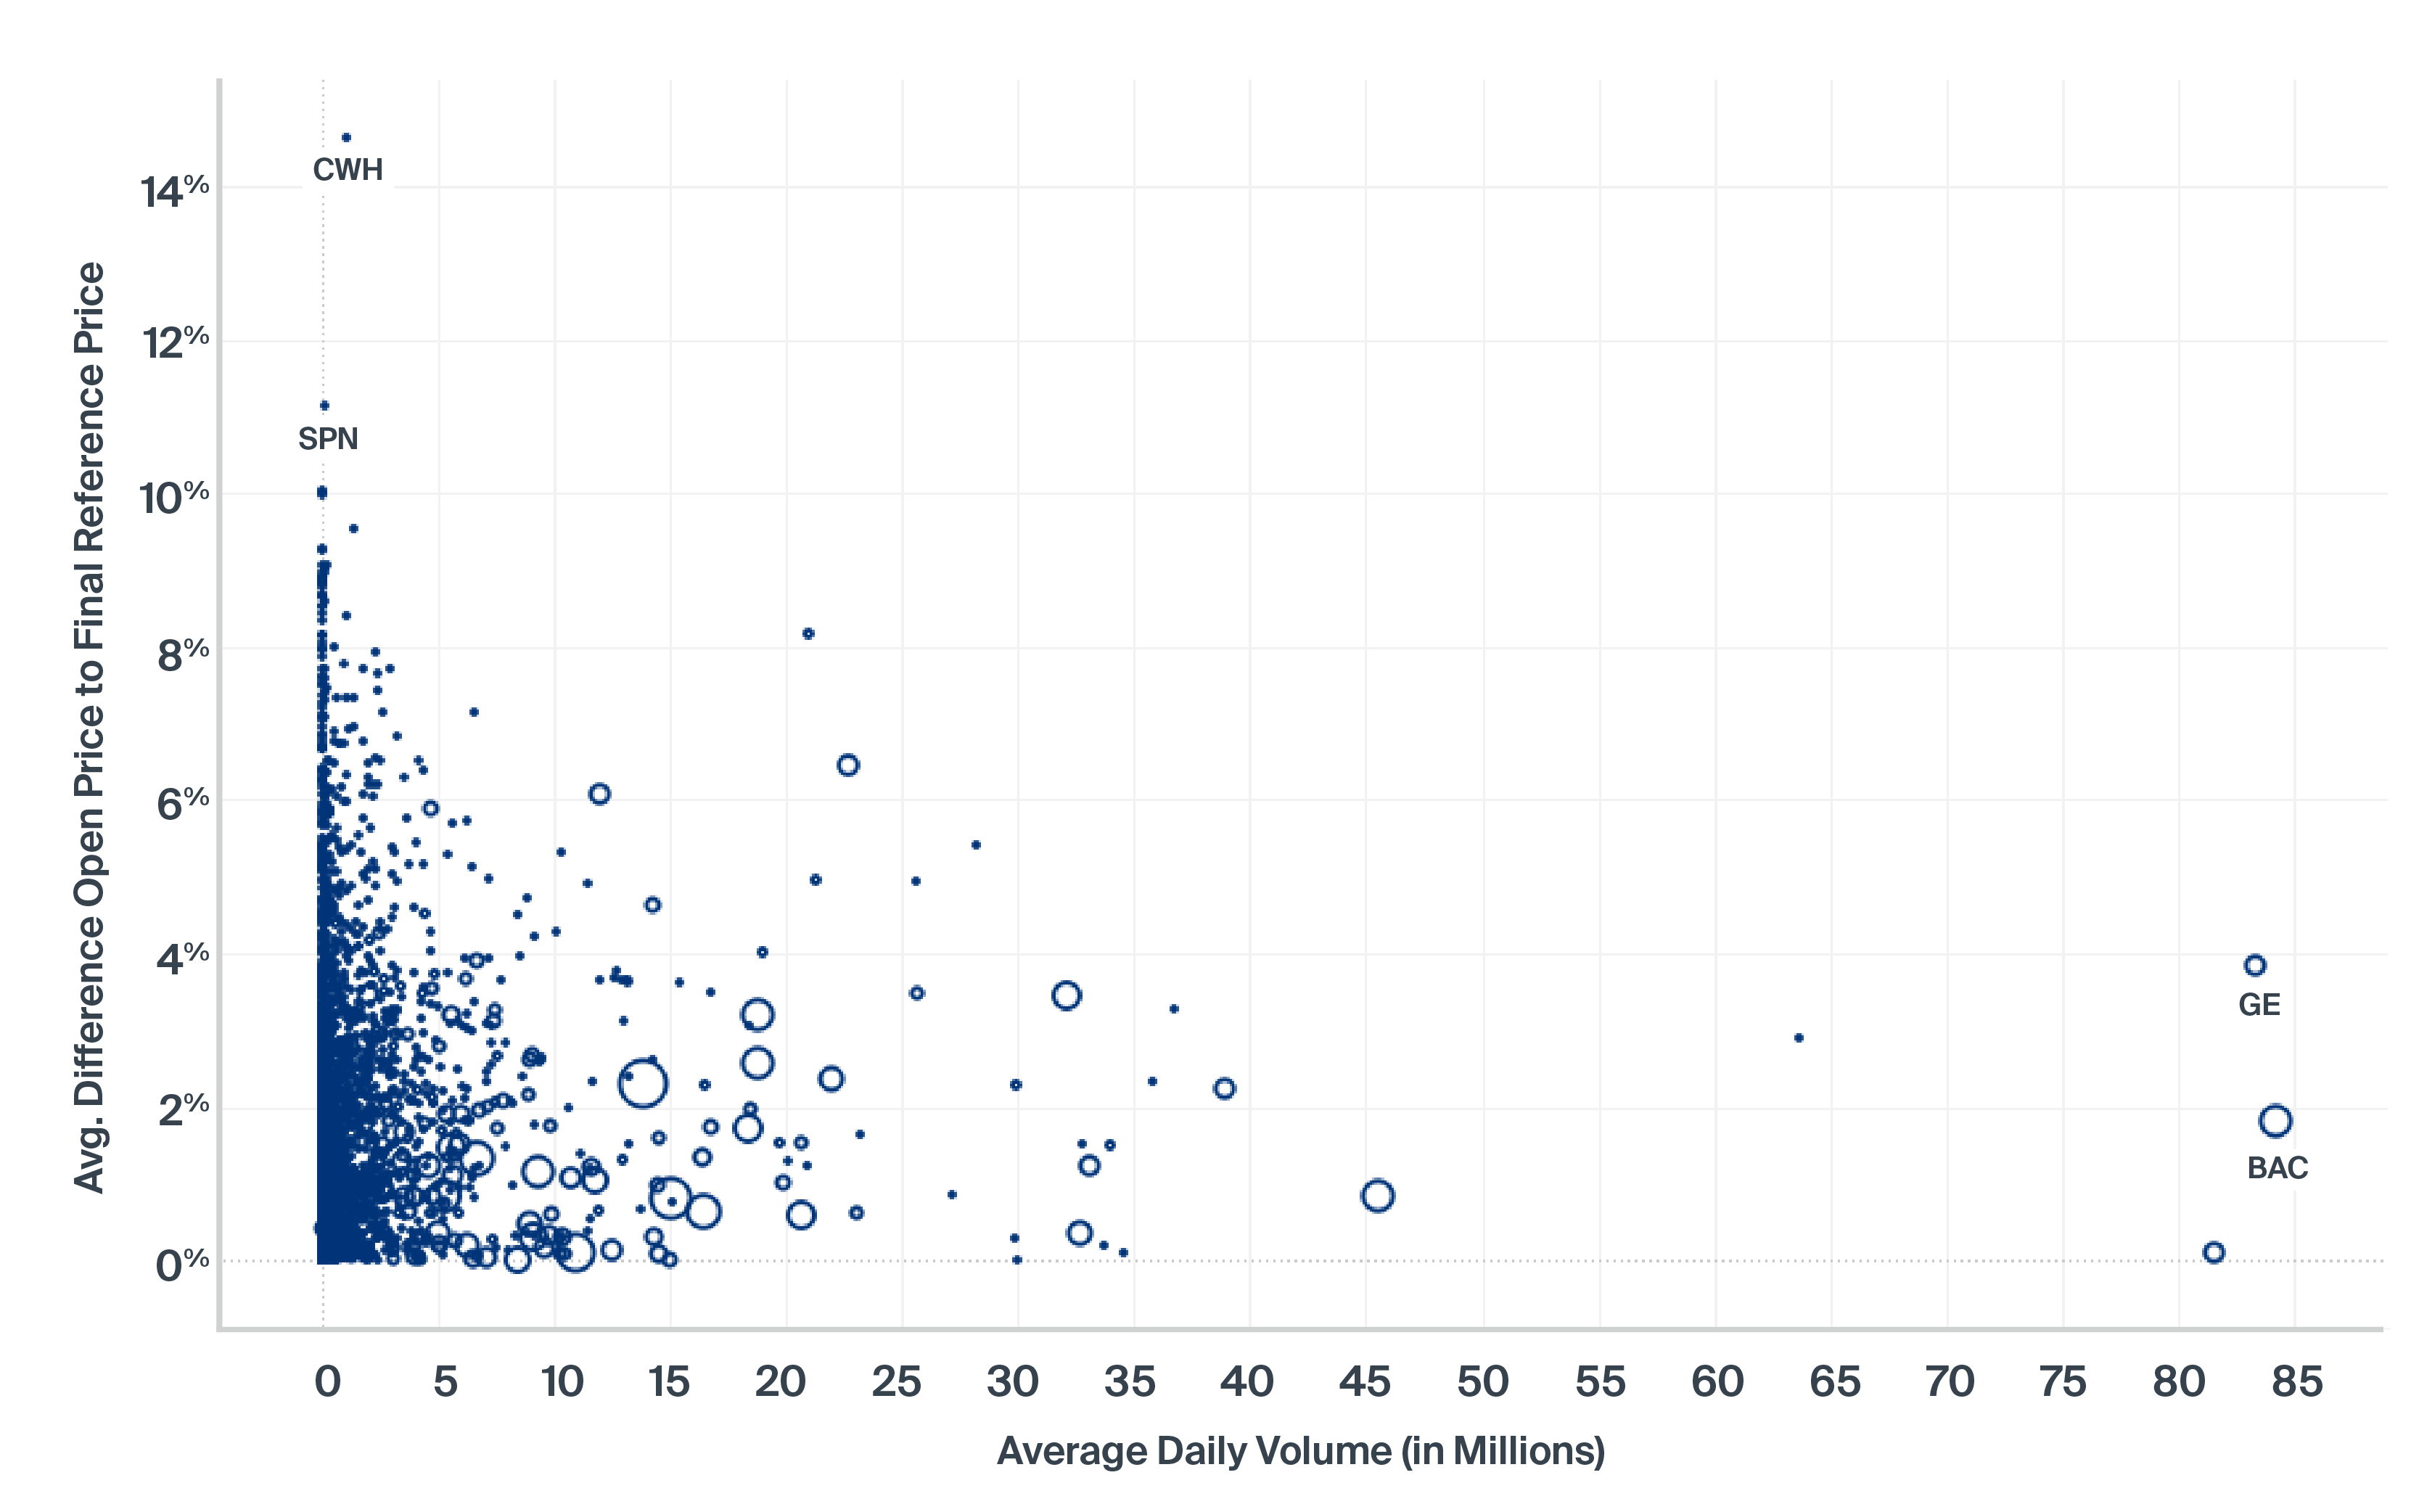
Collared auctions have occurred mostly in thinly-traded securities, where a small amount of trading interest can push the auction execution price a material distance from the auction reference price. The below charts compare the average difference between the final auction reference price to the actual auction price, plotted against average daily volume and sized by dollar value traded. These chart show:
- Most auctions execute well within the collar price boundaries
- Larger moves are much more likely in thinly traded securities
- Auctions with the most price movement also tend to be quite small
Final Reference Price to Opening Price vs ADV
March 23 - 25
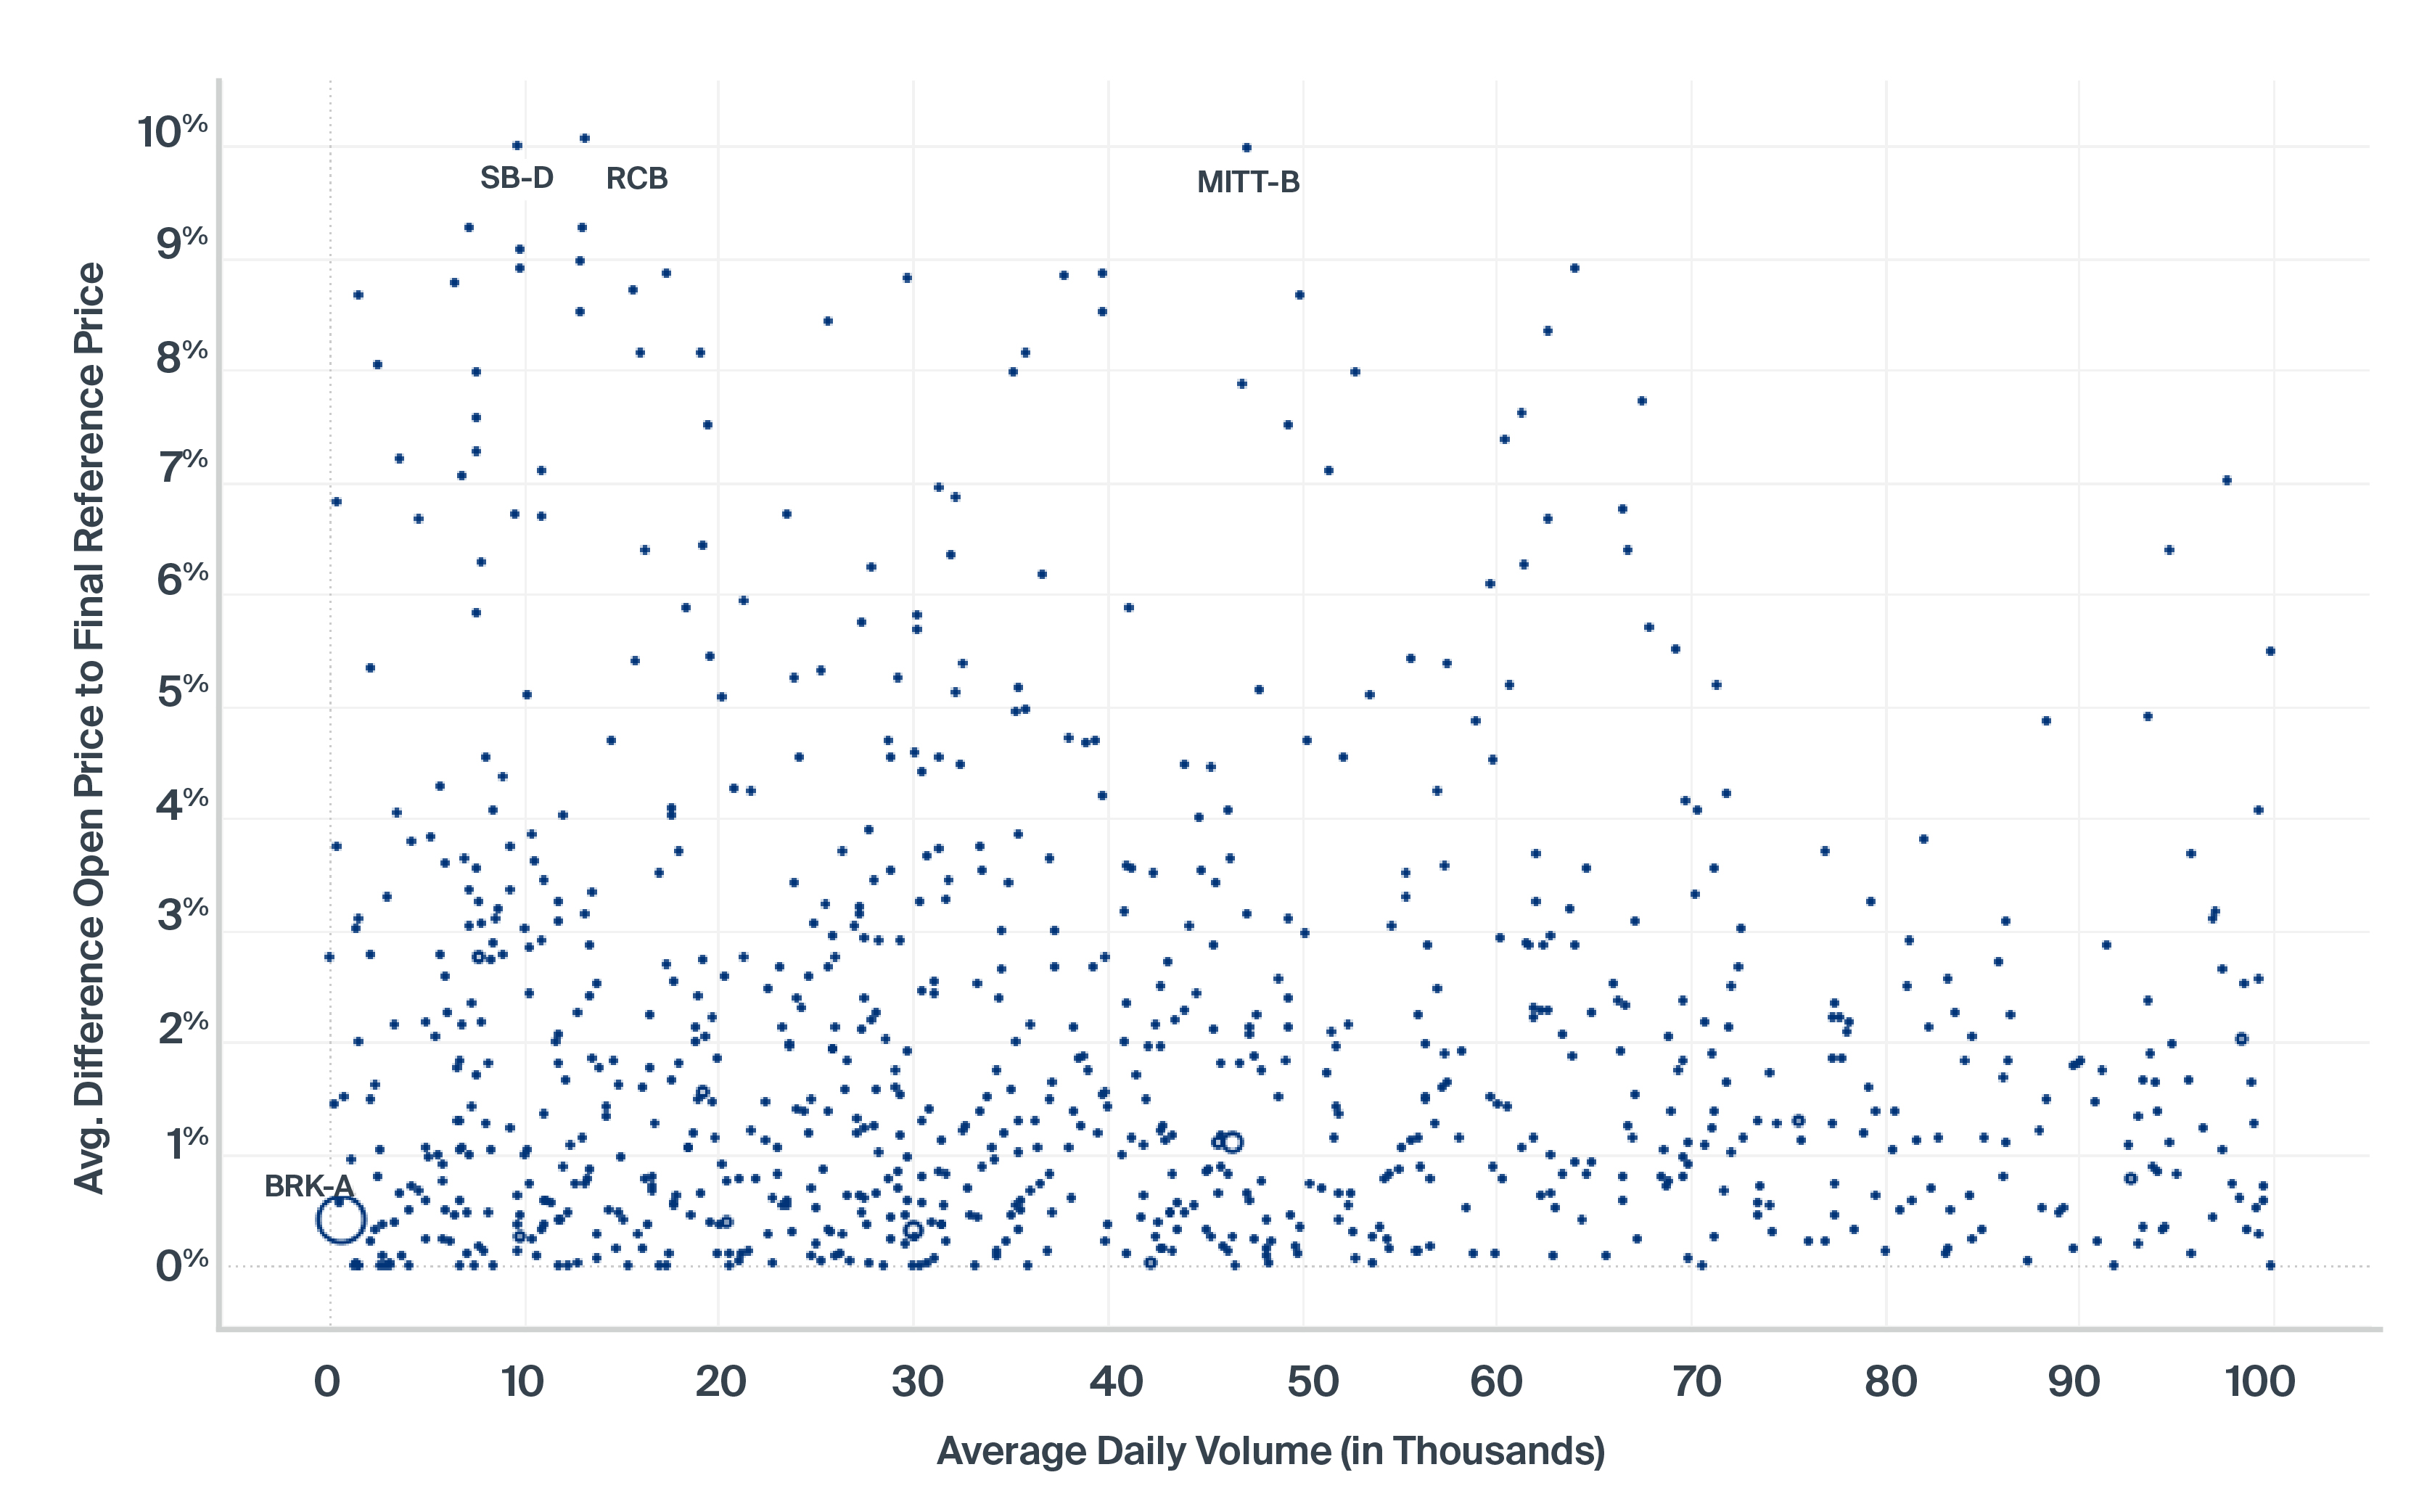
Final Reference Price to Opening Price vs ADV Symbols Under 100k ADV
March 23 - 25
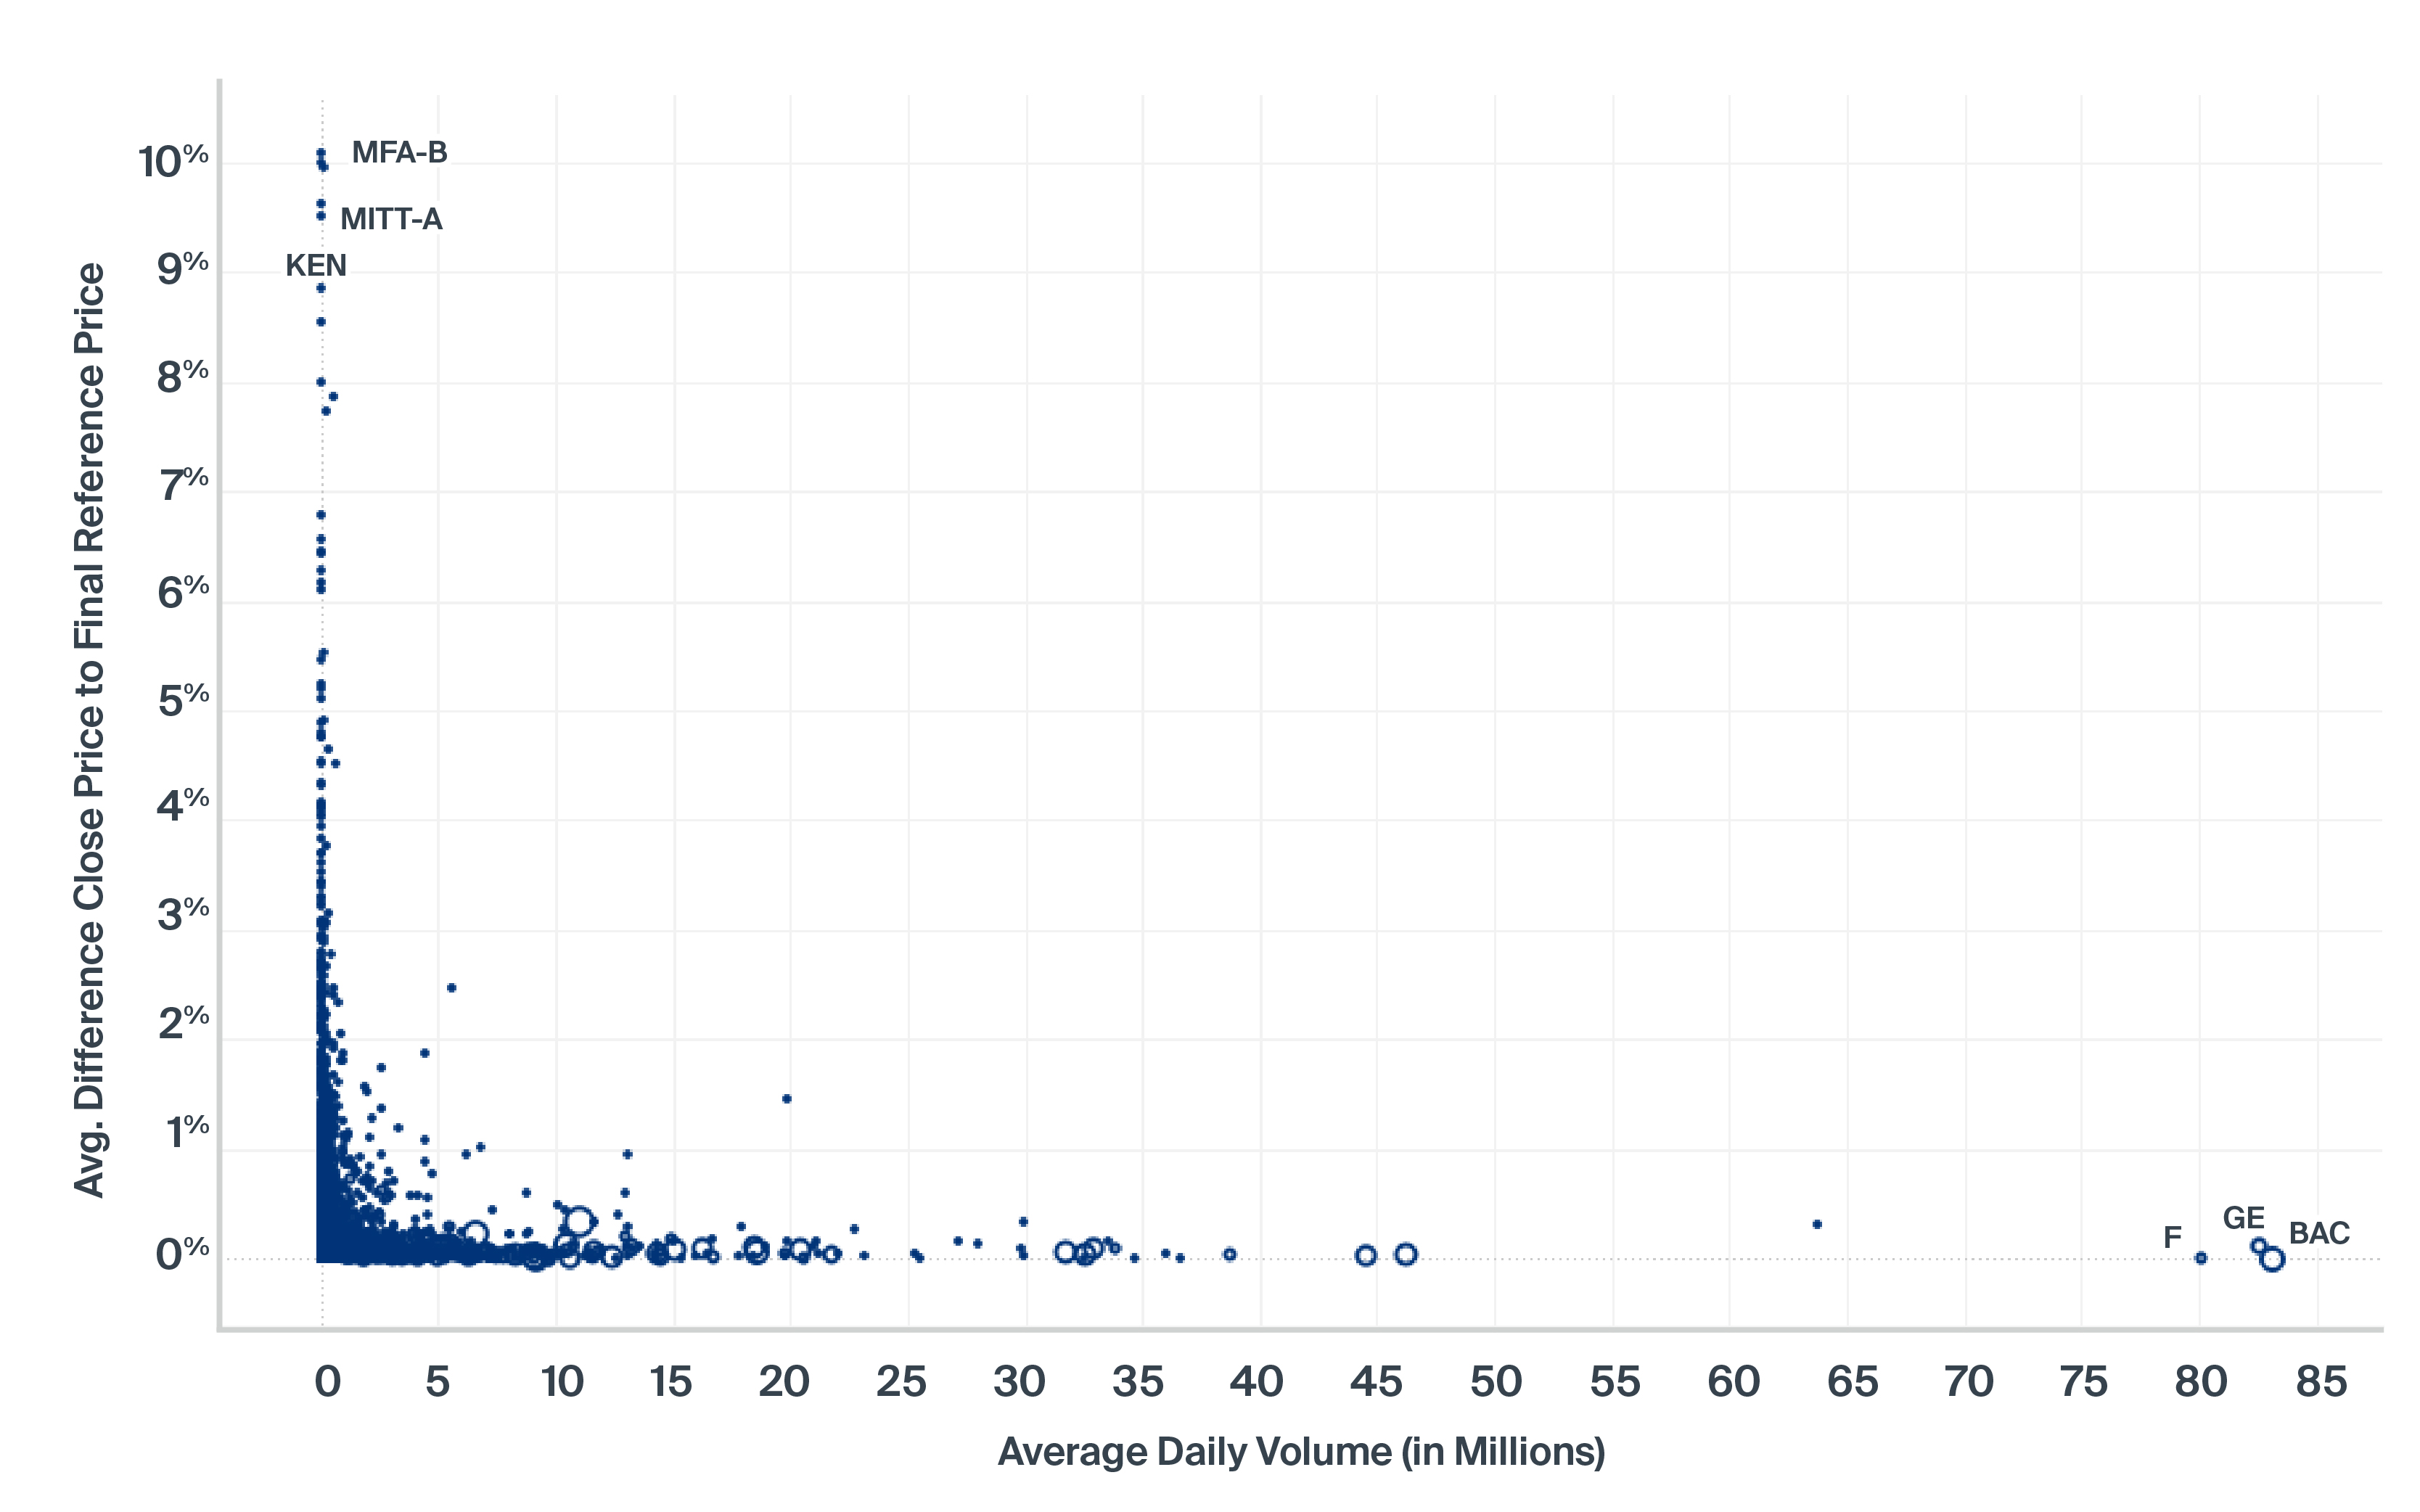
Final Reference Price to Closing Price vs ADV
March 23 - 25
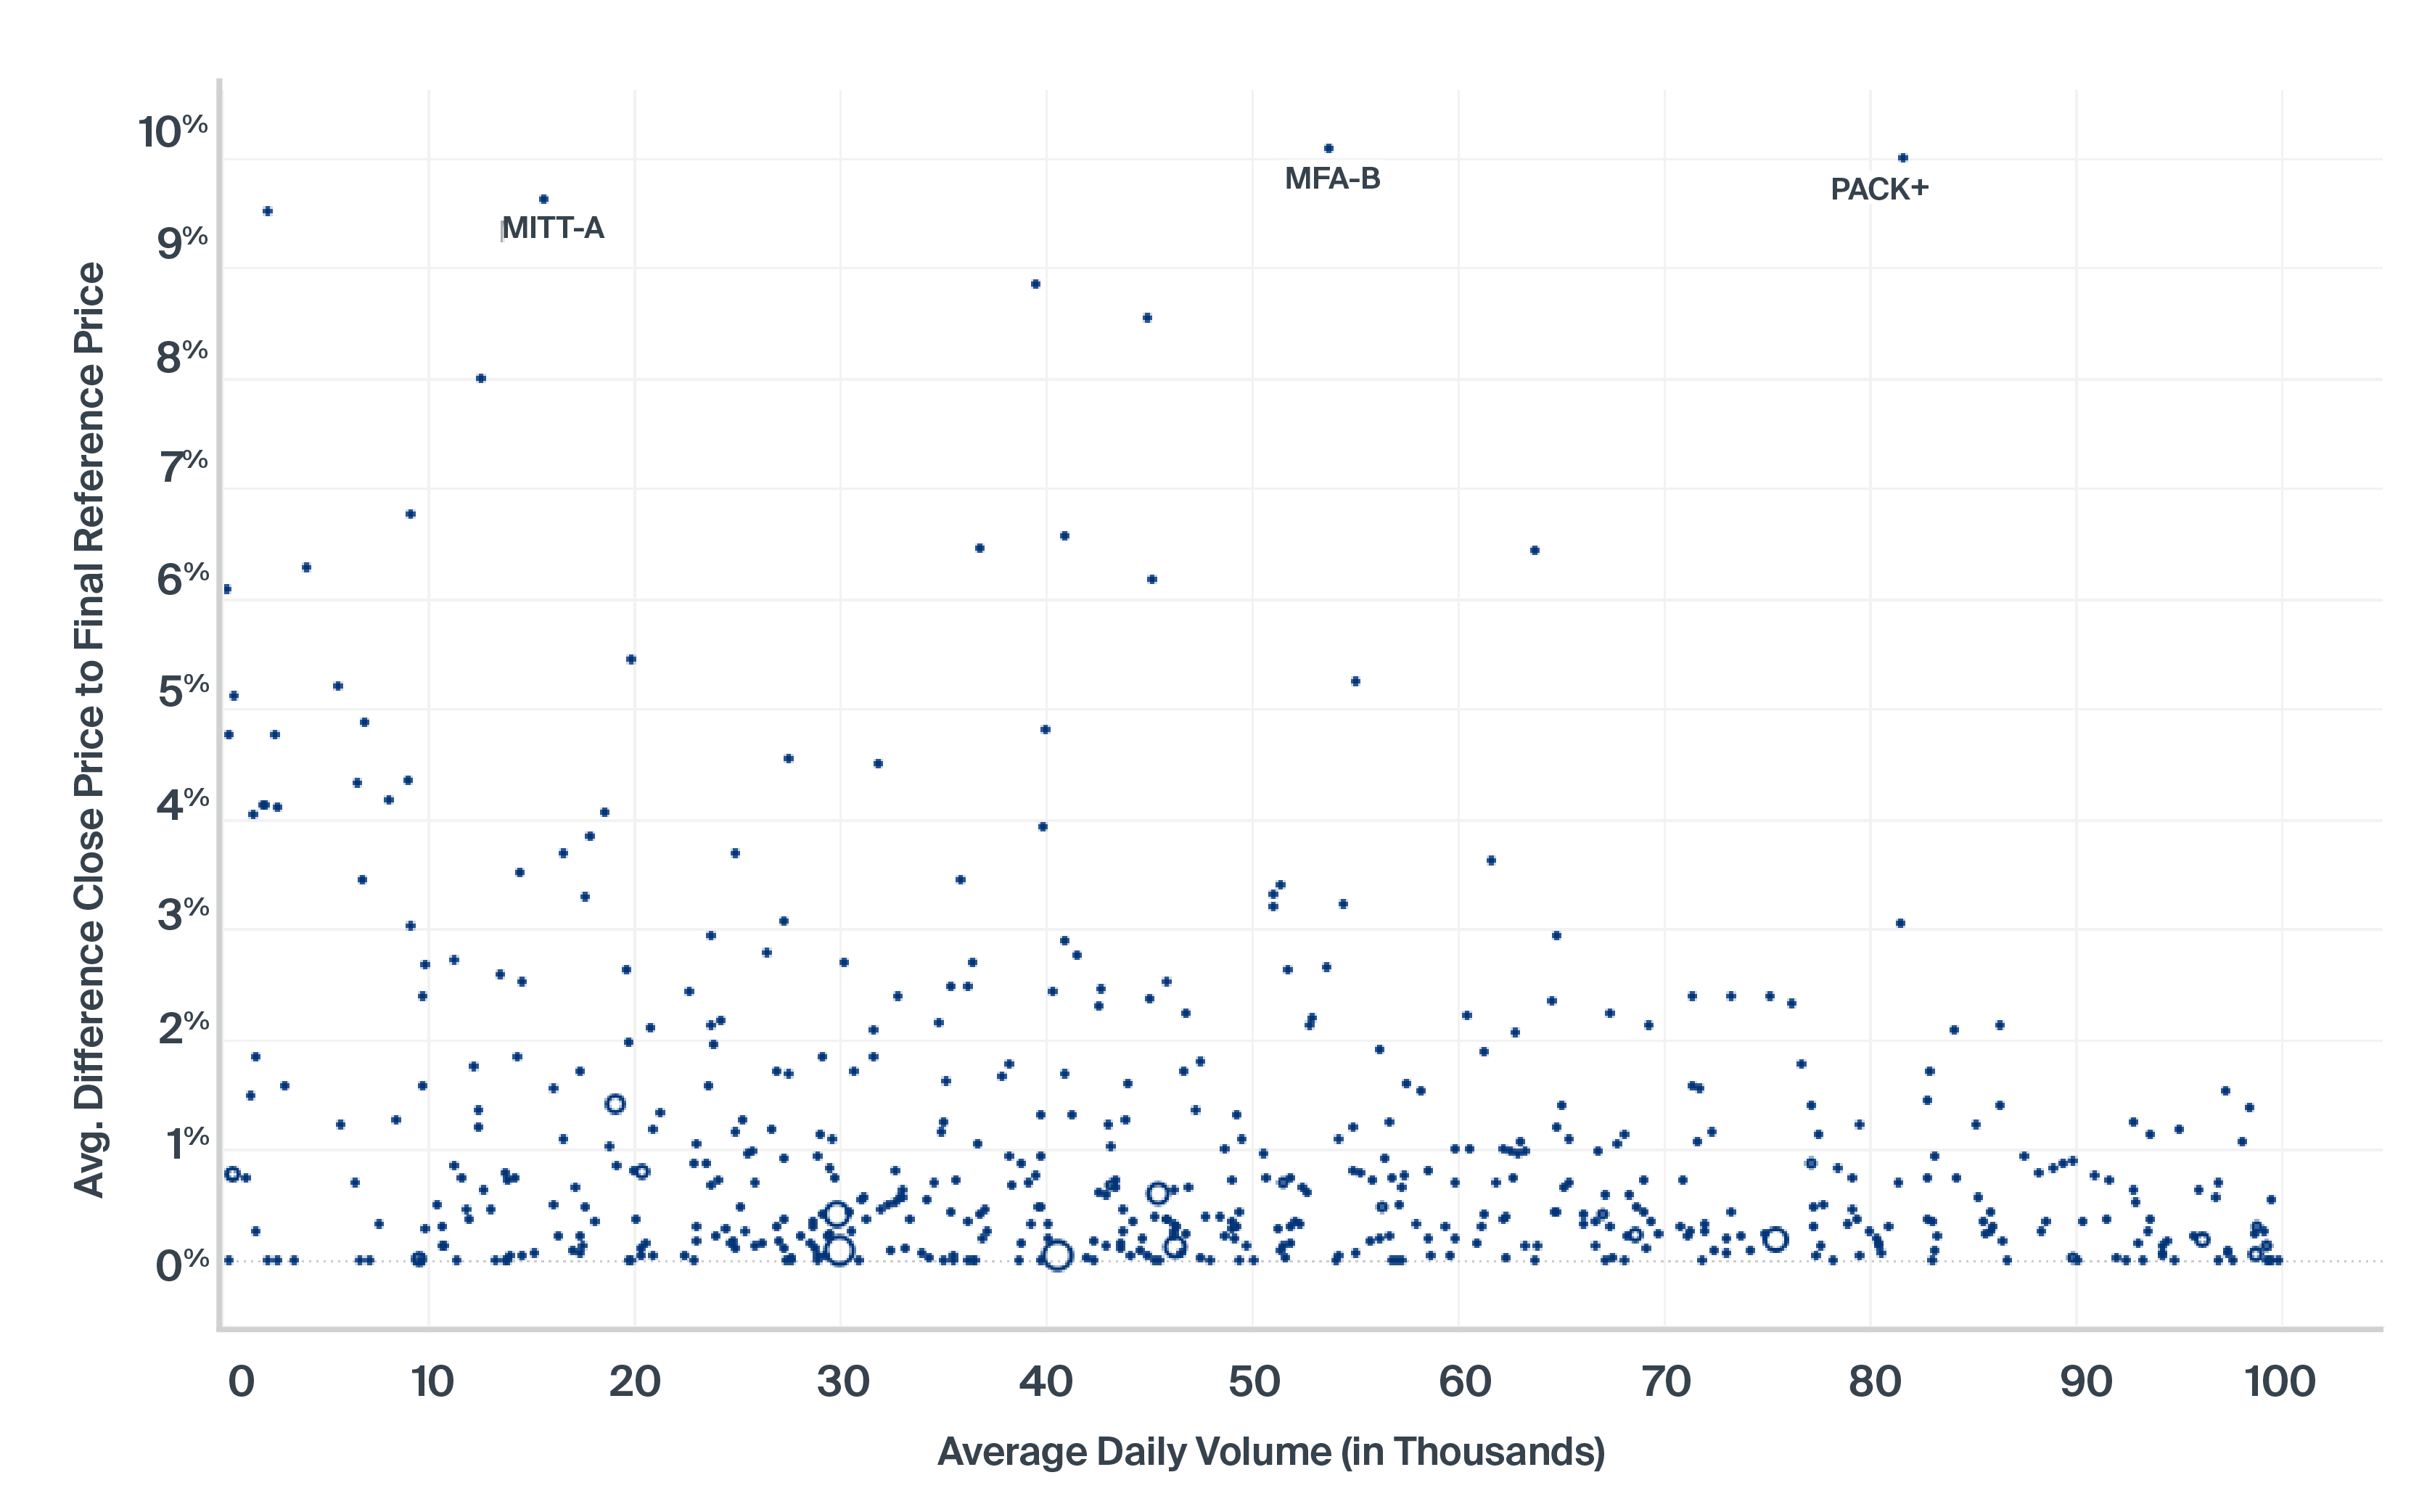
Final Reference Price to Closing Price vs ADV Symbols Under 100k ADV
March 23 - 25
Trader Action: How to Offset Imbalances
MOC and LOC orders can be entered without restriction up to 3:50 p.m. ET. Firms can submit offsetting MOCs/LOCs up to 4:00 p.m. if a Regulatory Imbalance of 50,000 shares or more is published at 3:50 p.m. MOC/LOC orders submitted after 3:50 that do not offset a Regulatory Imbalance will be rejected by the exchange.
NYSE also offers an electronic Closing Imbalance Offset (IO) order type that can be used to offset imbalances, does not influence price formation, but is not guaranteed to participate. Closing IO orders can be used for any size imbalance and are accepted on both sides of the market up to 4:00 p.m. Similar to MOC and LOC Orders, they can be cancelled between 3:50 and 3:58 only for a legitimate error, and cannot be cancelled after 3:58 p.m.
For more information on the NYSE Auction, please see our FAQ or at or contact us at [email protected].
1 This excludes short sales in securities under a short sale restriction, which may remain unexecuted regardless of auction price collars.
NYSE Research Insights
Find all of NYSE Research's articles on market quality, market structure, auctions, and options.