July 10, 2018
Our previous post highlighted how end investors could potentially bear increased costs as a result of the SEC's proposed Transaction Fee Pilot. As we expected, the post triggered a significant amount of public debate, as well as discussion between the Exchange and members of the buy and sell-side. This is an important topic worthy of discussion.
This follow-up post provides additional detail of our original calculations. We have also prepared a sensitivity analysis highlighting that substantial costs would remain for investors even if our reasonable assumptions prove, in practice, to be either too aggressive or conservative. Finally, in the interest of inviting parties to reach their own conclusions, we have created an interactive model that enables readers to input their own assumptions related to venue and liquidity type distributions. By providing their own data, readers can see the resulting estimated impact.
Key Points of the Original Analysis
- The original analysis considered the fee pilot's impact on liquidity-taking flow because:
- Institutional and retail investors take liquidity more than they provide liquidity;
- These investors generally pay fixed commissions and likely will not receive the benefit of lower exchange fees and, therefore, will bear the cost of wider spreads; and
- Investors providing liquidity may benefit from the wider spread by (1) posting at less aggressive prices if they join the (now wider) NBBO, or (2) seizing opportunities to set a tighter NBBO with less competition from market makers. In either case, we anticipate these are relatively weak effects, and it’s important to note they are in conflict with one another.
- We assume that a reduction in access fees would result in a corresponding reduction in rebates.
- Rather than attempt to quantify the impact of the pilot for each bucket, we used a weighted average fee/rebate reduction based on the total number of stocks that would be impacted by the pilot.
- This approach yields an average fee/rebate reduction of 8.2 mills across all stocks.
- The fee/rebate reduction across just the 3,000 pilot securities will be substantially higher, but given that we do not know which securities will be included it is appropriate to apply the lower average reduction across the broader universe.
- We then use this value to 1) estimate the change in spreads, and 2) estimate the additional cost borne by liquidity-taking flow.
- We assume that the change in spreads applies market-wide, including to non-maker/taker venues on the basis that maker/taker exchanges drive the inside quote far more frequently than taker/maker or flat fee exchanges
- The cost calculation measures the change in cost to take liquidity, using the midpoint of the spread as the benchmark price.
- The calculation charges 100% of the higher spread cost to the (conservatively) estimated share of agency-taking volume.
- Our assumptions in this scenario are as follows:
- Agency Share (based on NYSE Arca taking volume) is 49%
- Maker/Taker Venue Share is 52%
- Market average daily volume ("ADV") is 7.2 billion shares; average notional value is $368.7 billion
- Change in spread is 0.32bps
- Principal taking volume is charged the higher spread cost, less the reduction in access fees.
- Agency Cost:
Change in Spread*1/2 * Market Notional Value * Agency Share
- Principal Cost:
[Change in Spread*1/2 * Market Notional Value * Principal Share] - [Fee Reduction * Market Volume * Principal Share * Maker/Taker Venue Share]
Sensitivity Analysis
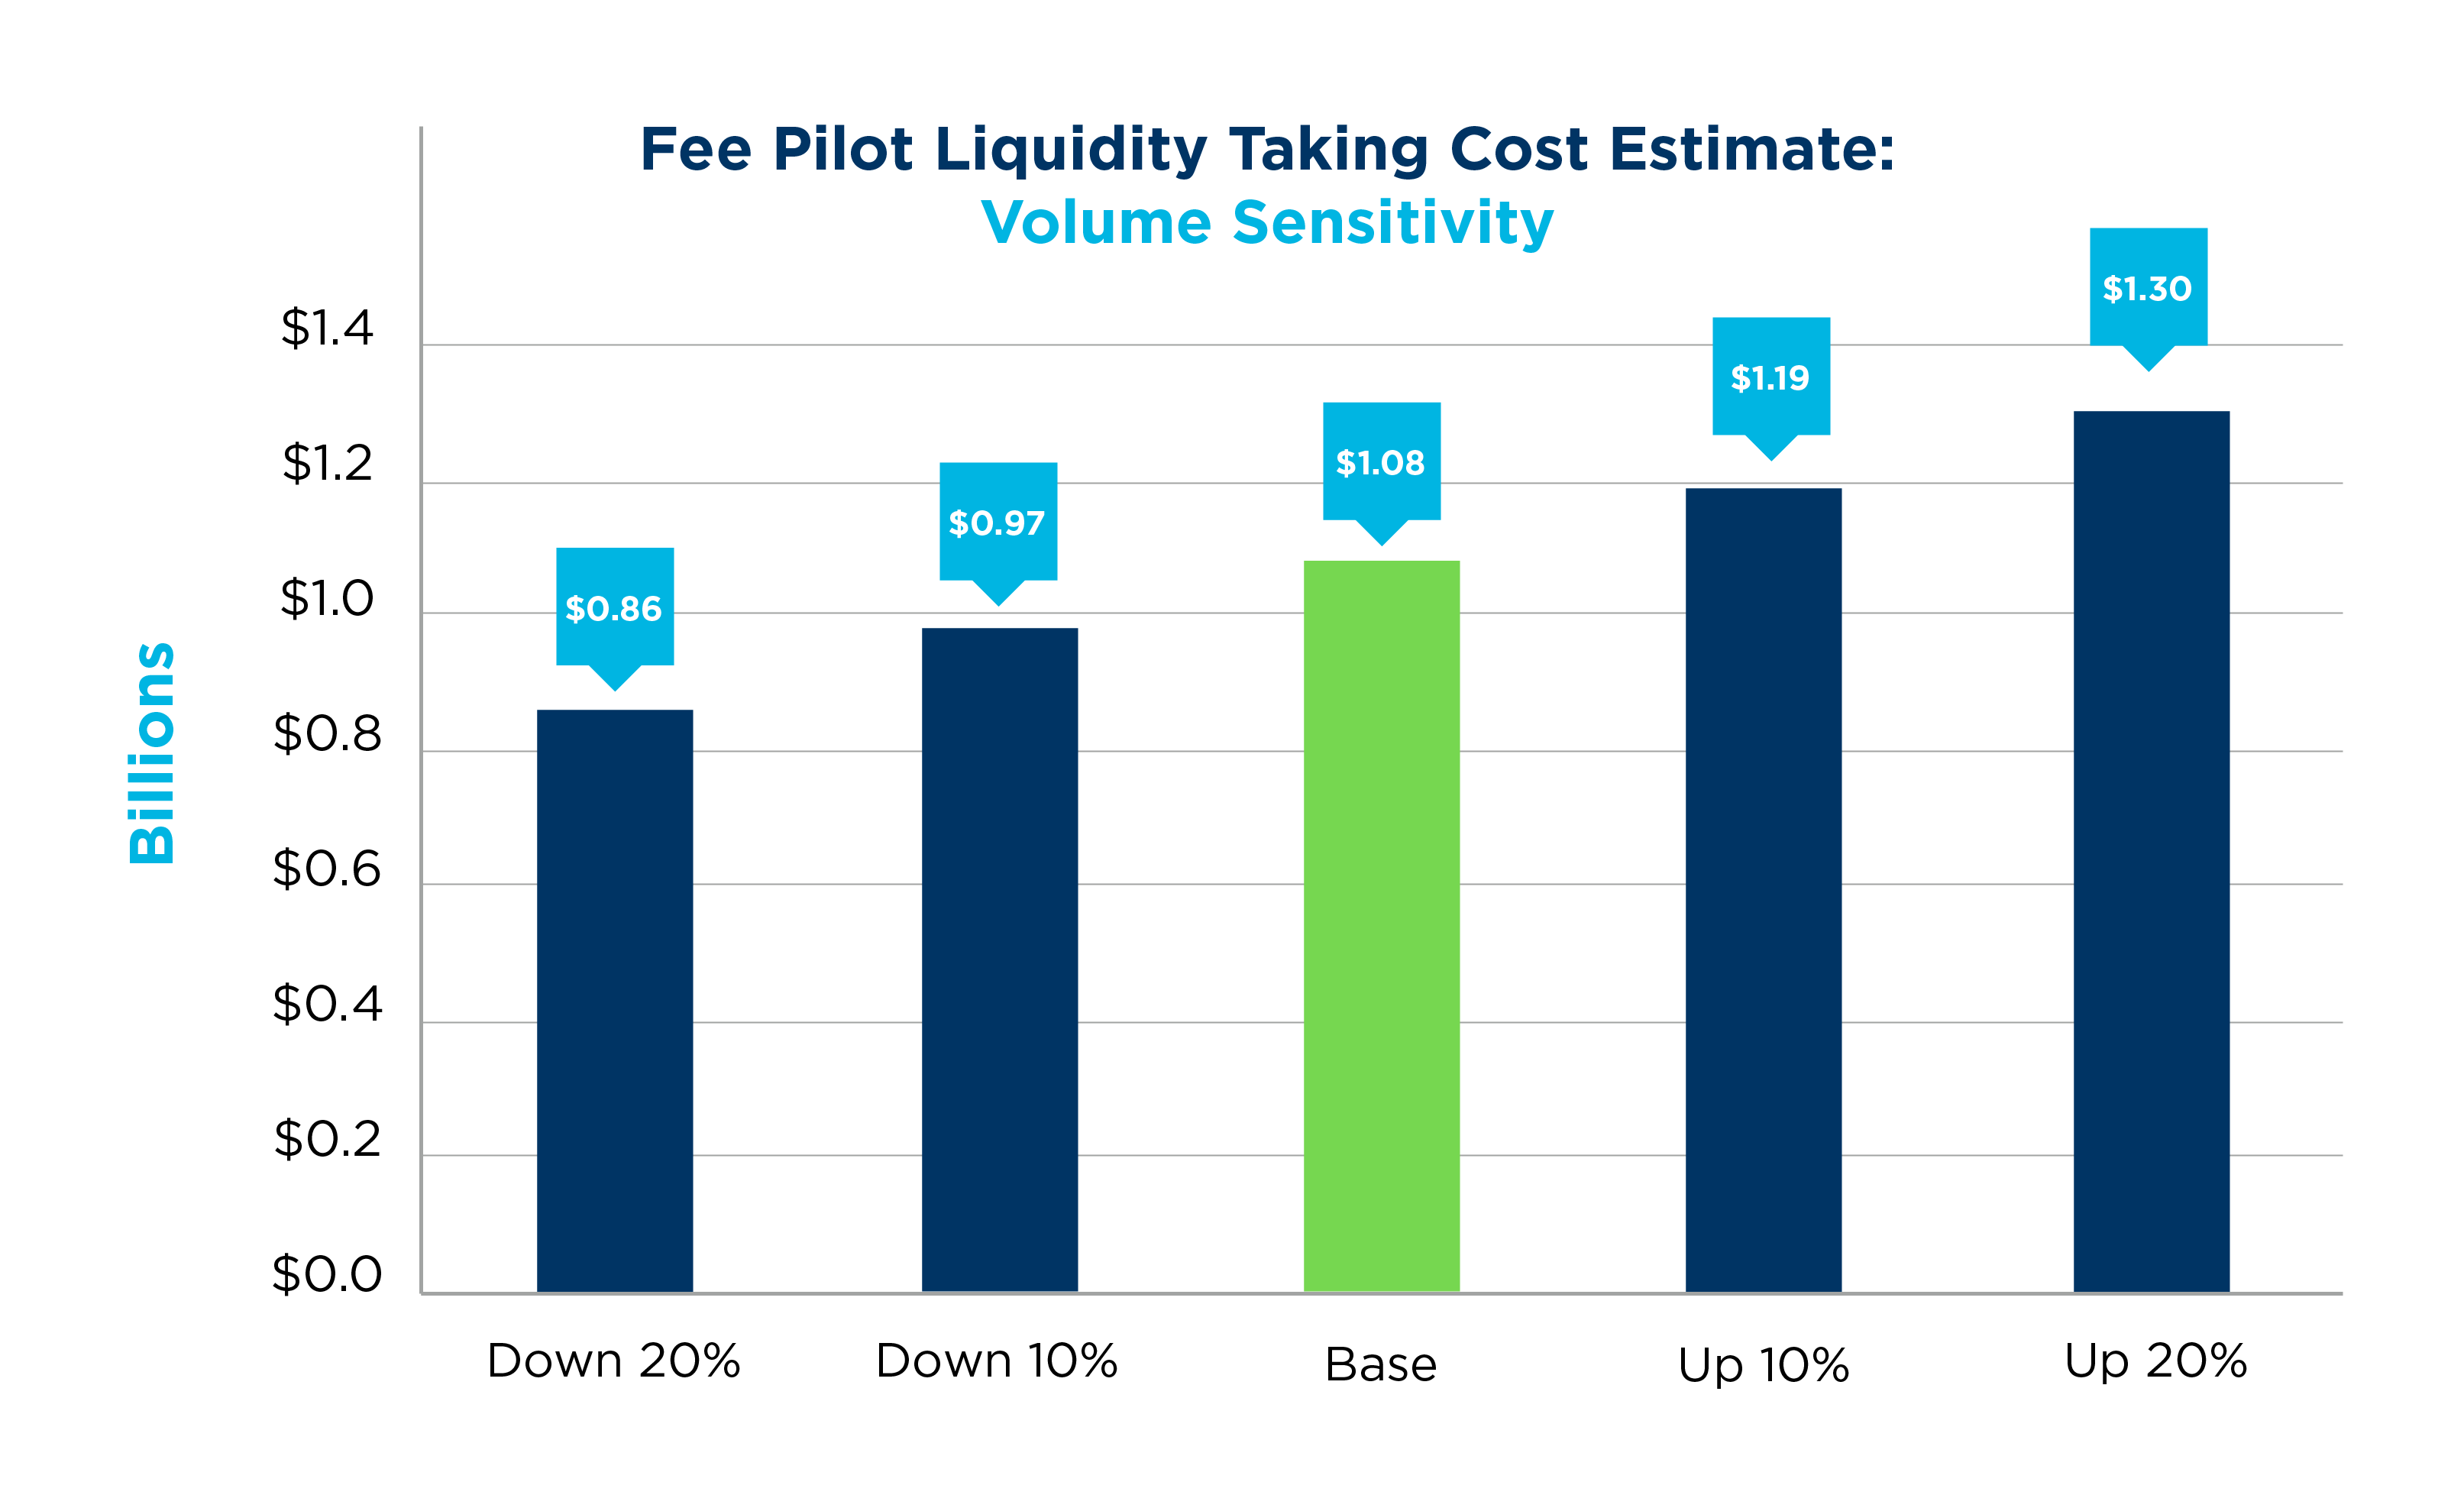
- Our volume assumption used a year-to-date ADV at the time of the analysis.
- We tested the model by increasing and decreasing the volume figure by up to 20%.
- This accommodates the observation that some market activity may not be directly impacted by wider spreads, such as auction volume and midpoint volume.
- Decreasing the volume assumption by 20% results in a cost of ~$0.86 billion, compared to the ~$1.08 billion original estimate.
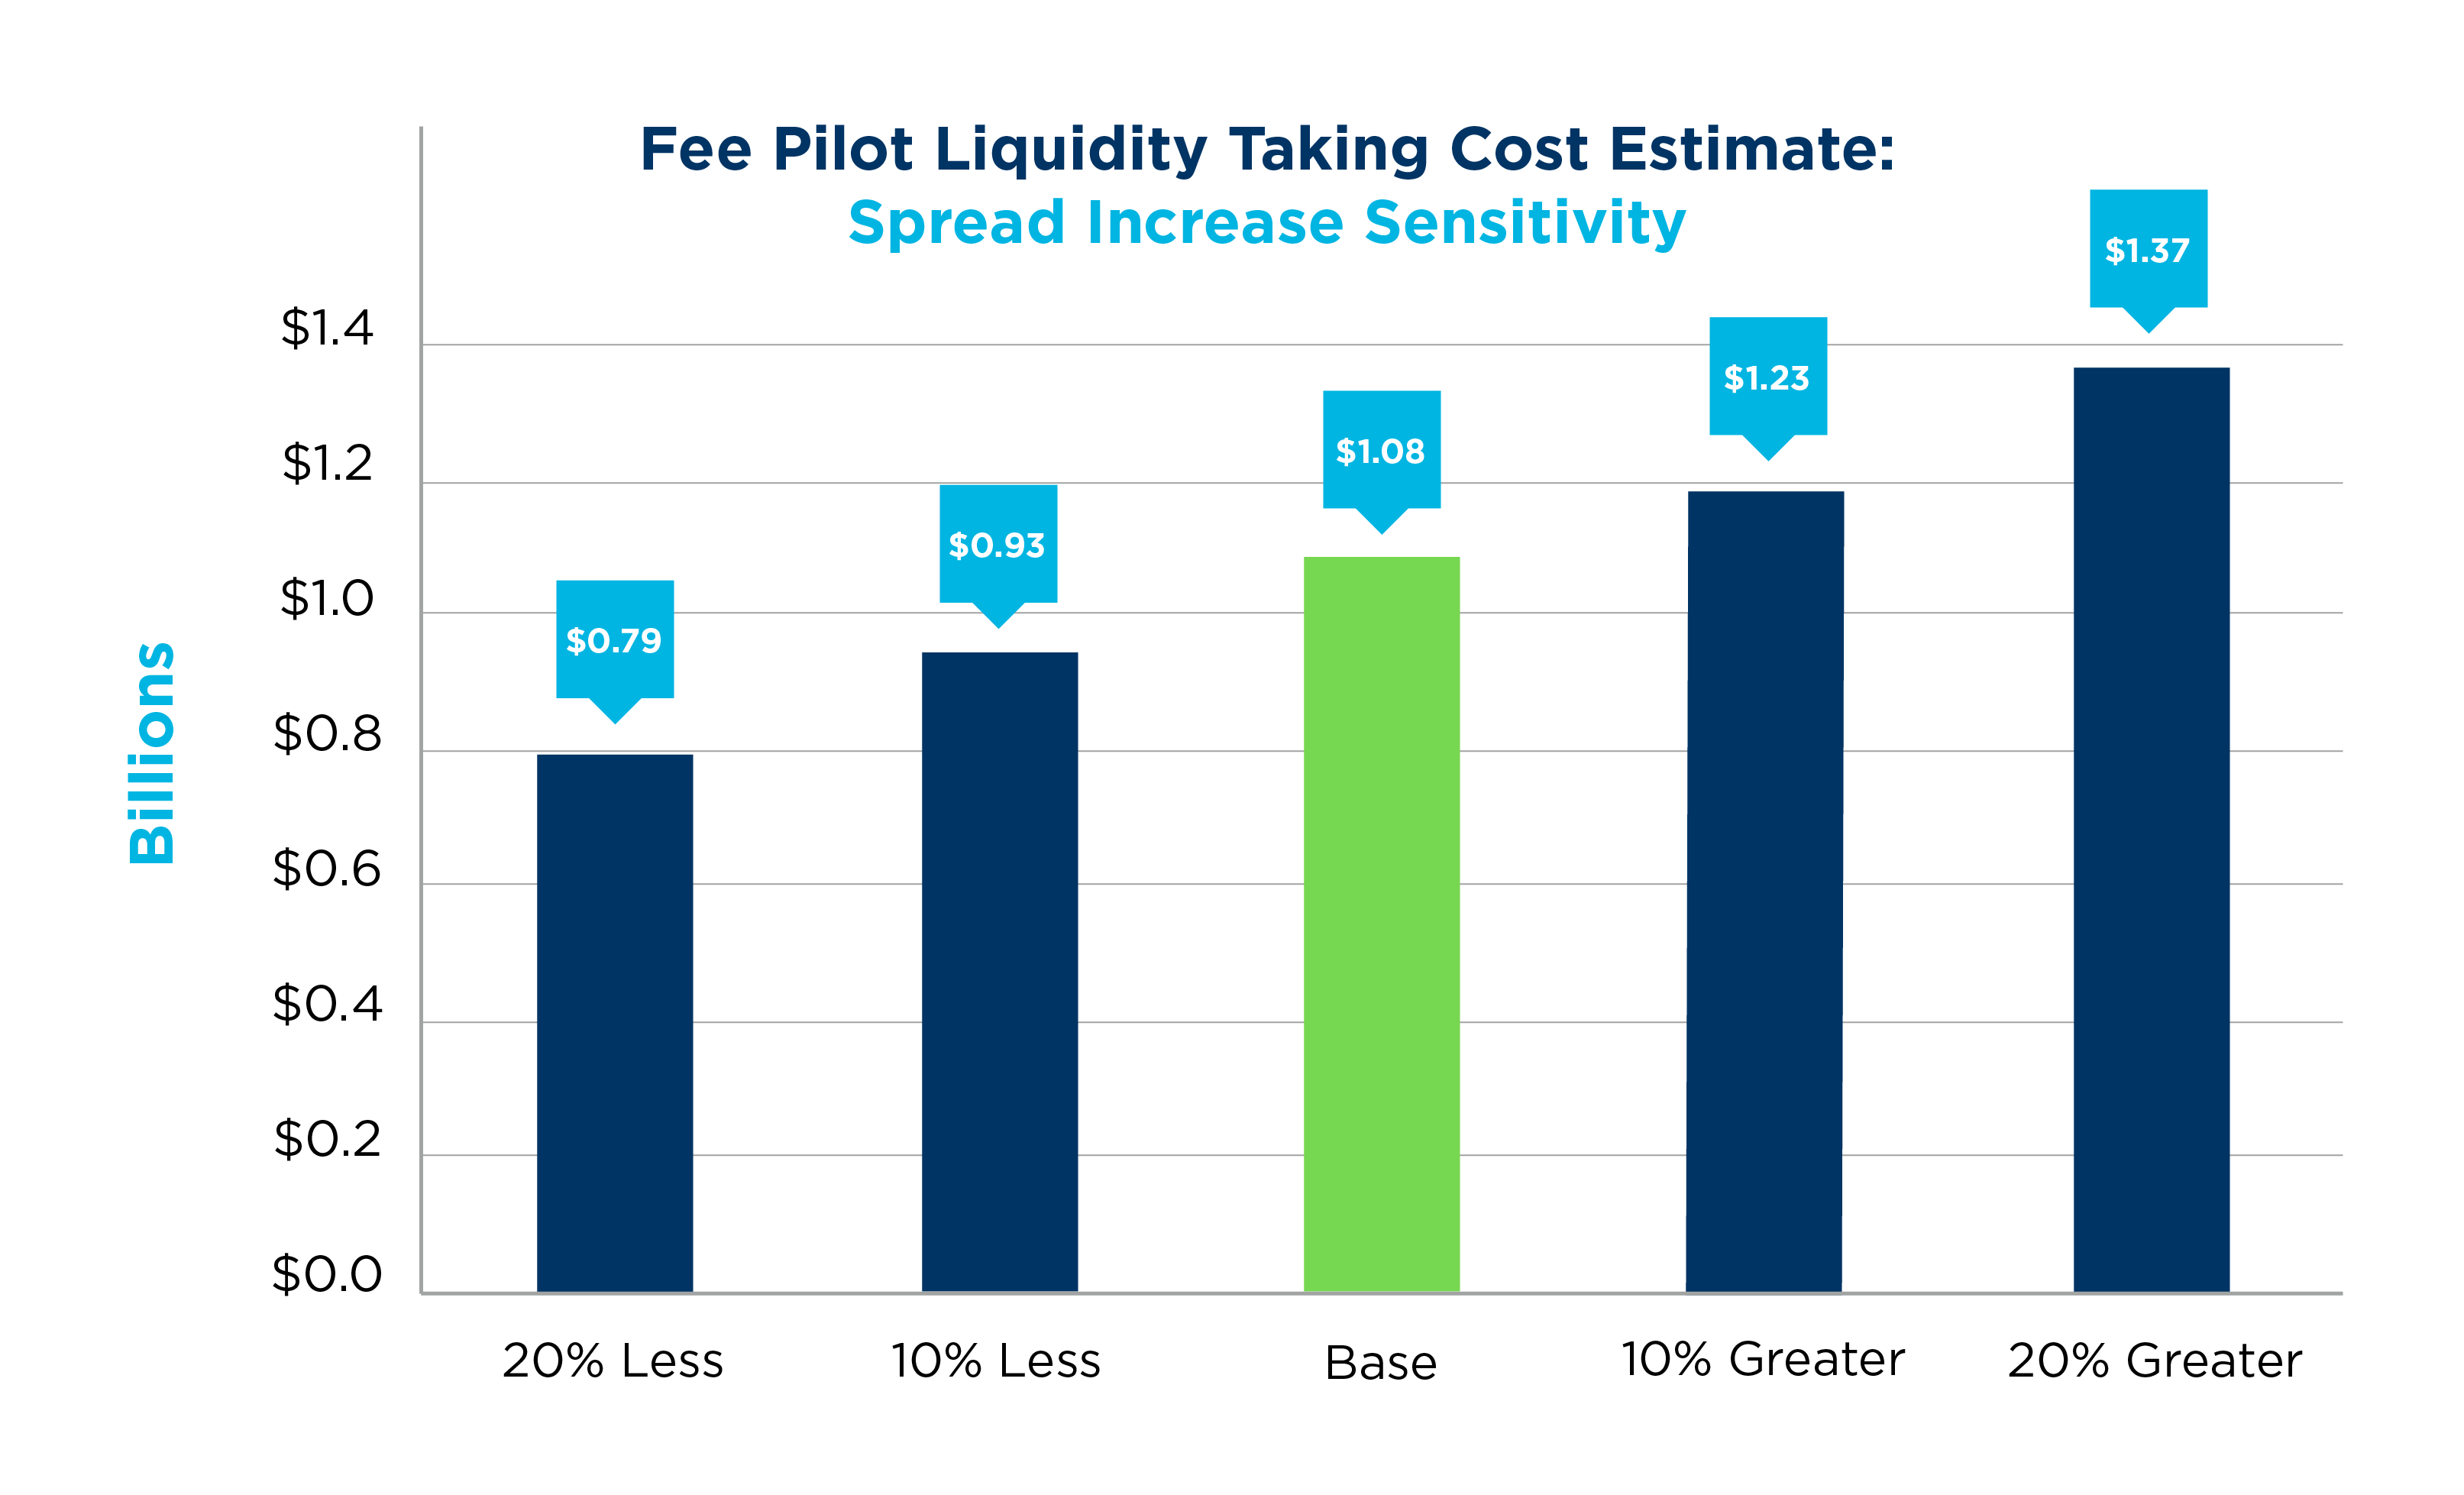
- The impact estimate is more sensitive to spread changes than volume changes:
- If we over-estimated the spread increase by 20%, our cost estimate would be $0.79 billion compared to the ~$1.08 billion original estimate.
- Conversely, if spreads widen more than we anticipate, costs will increase.
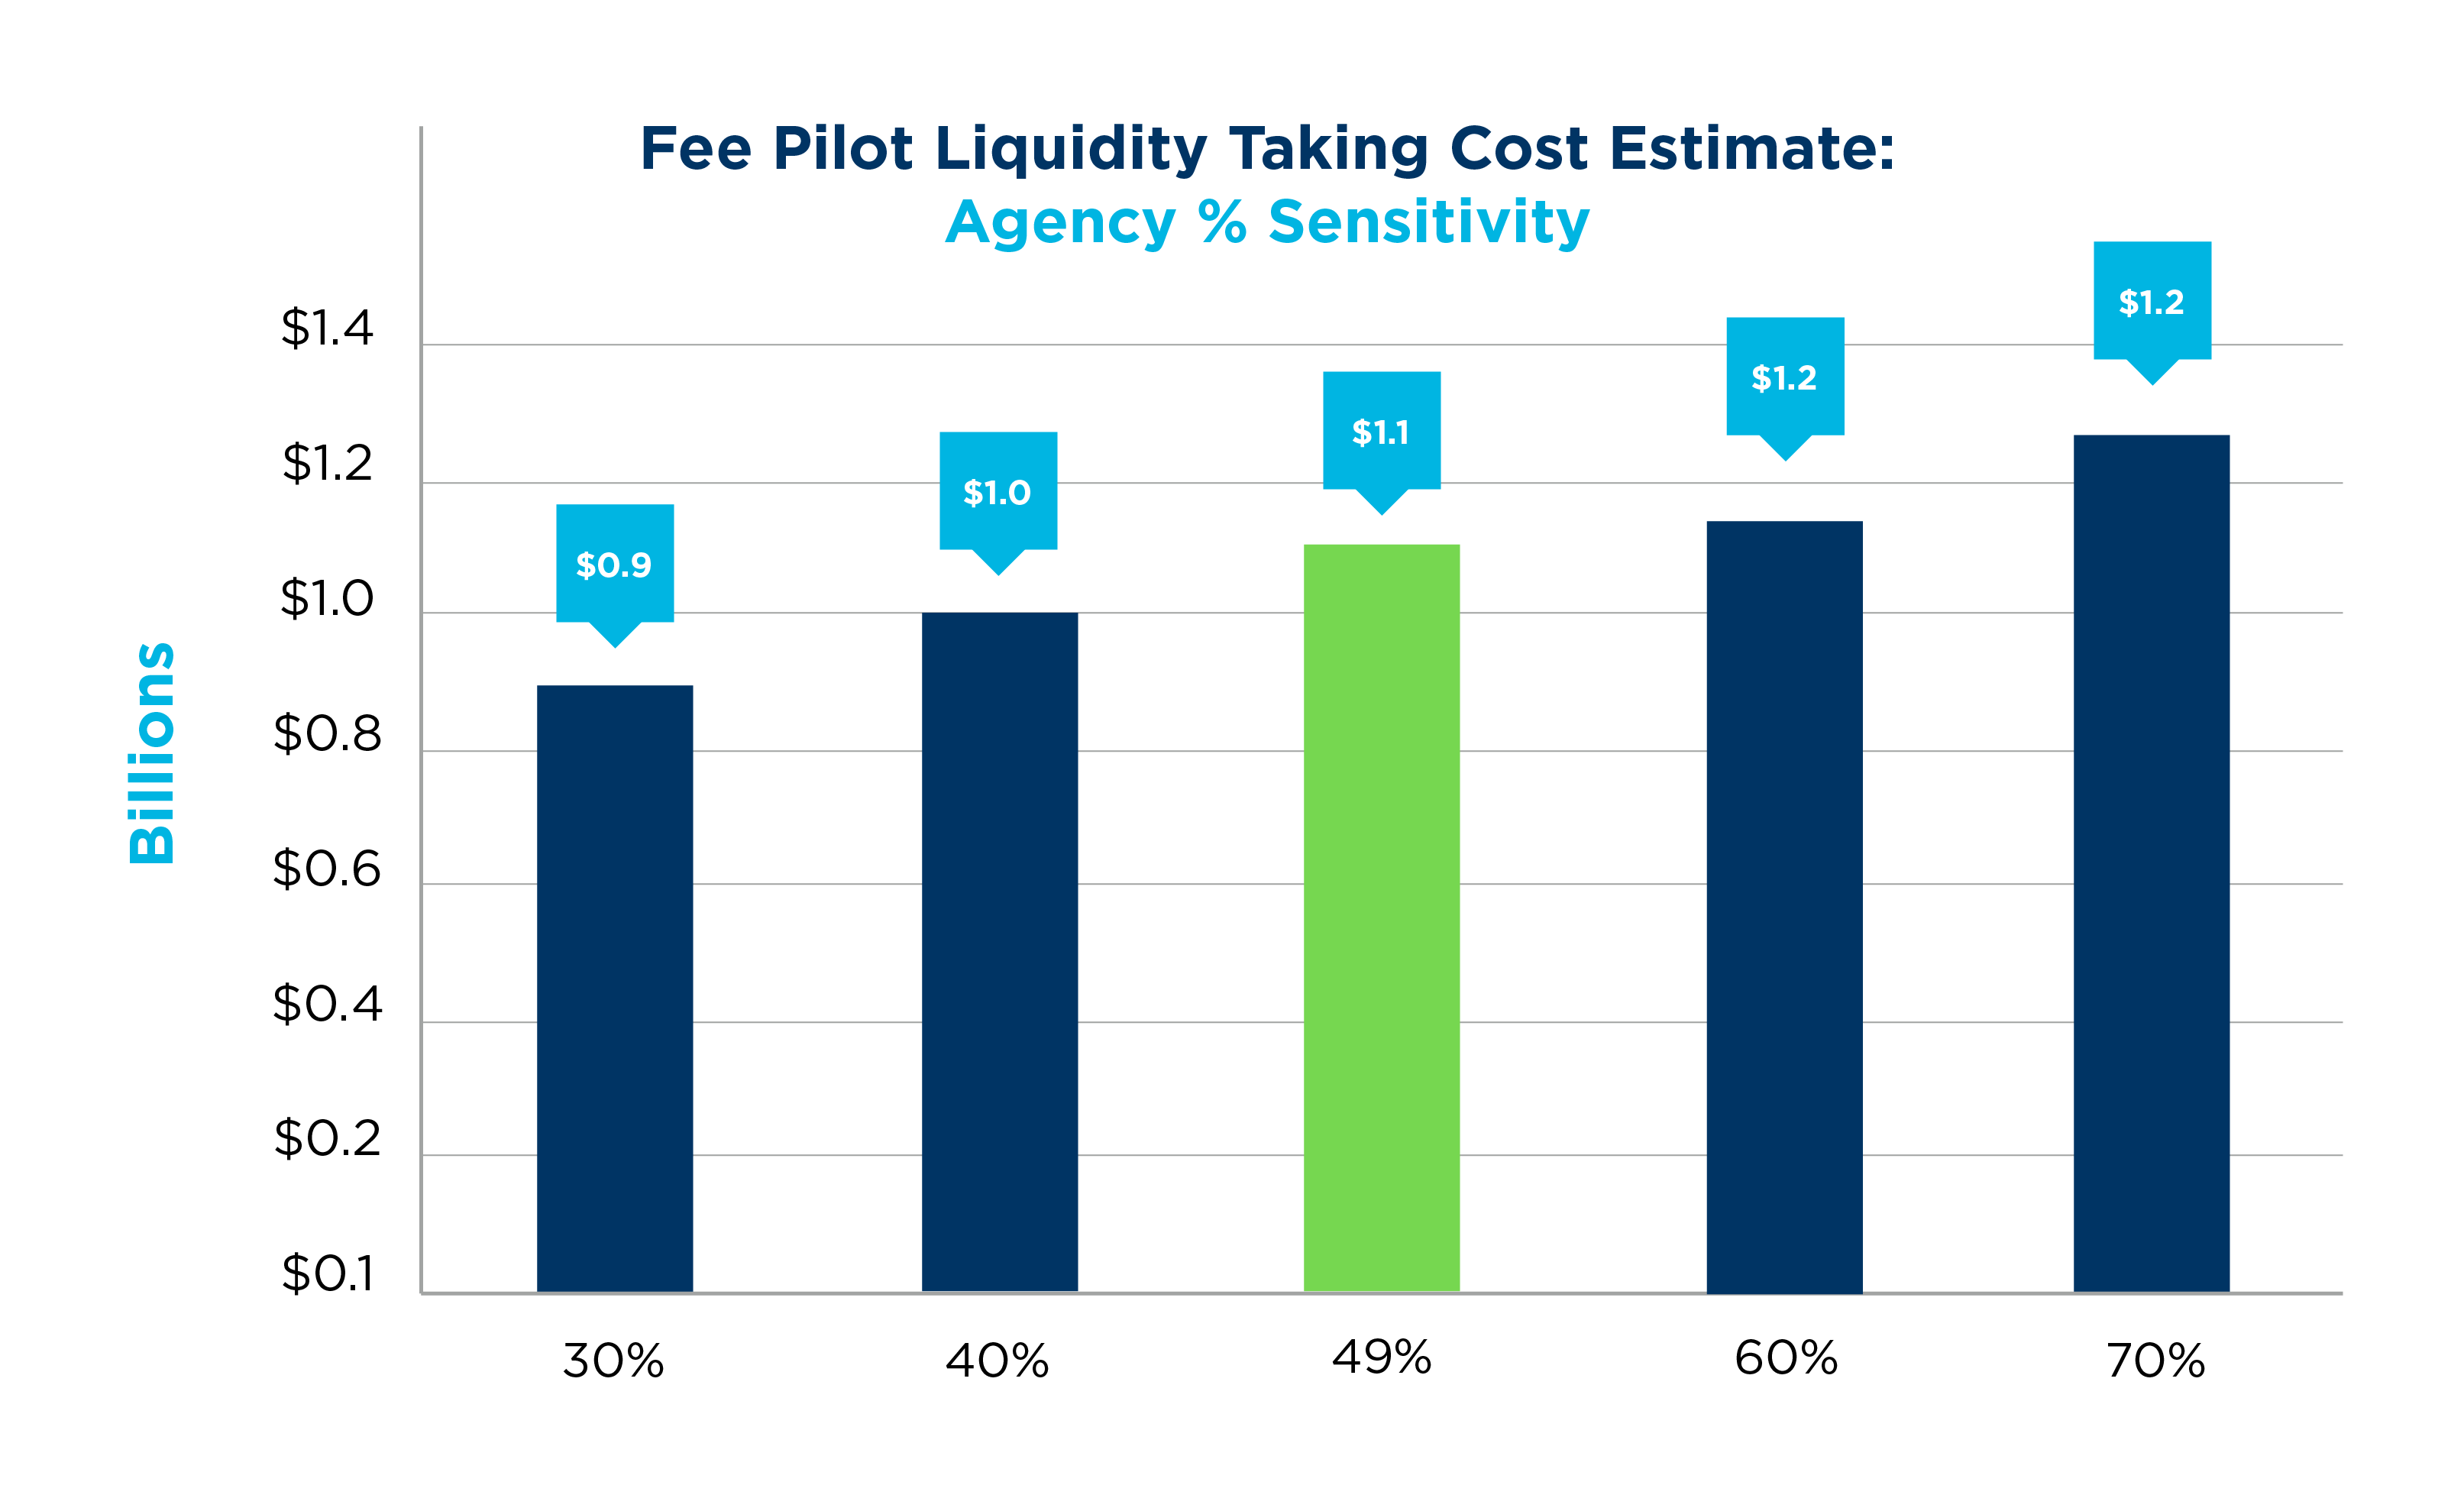
- While we feel that our agency share of volume was appropriately conservative, the impact estimate shows relatively little sensitivity to this metric.
Interactive Model
As noted in our introduction, we are providing a spreadsheet that enables users to input their own assumptions so they can arrive at an estimated annual impact from their firm's own data. The model includes a robust set of venue and liquidity action variables, enabling users to customize volume mixes for variables such as add/take, standard/inverted/dark venues, etc. We also include a Yes/No variable for cost-plus or pass-through pricing models. Many of the questions generated by our initial post related to volume and activity assumptions, and we expect that this model will enable readers to review their own activity distribution and see the resulting impact estimate.
Download the Interactive Model
Conclusion
We consider the substantial debate around our original post a welcome outcome. We achieved our goal of encouraging discussion of the possible impacts of the SEC's proposed Transaction Fee Pilot. We hope that future commentators will attempt to include substantive and quantifiable data in support of their stance, as we have tried to do here. We welcome feedback and continue to believe that the proposal will result in increased costs to investors due to wider spreads. We agree with the general view of many who have commented that no one can precisely predict the future and that several assumptions are required to model the possible results of the pilot. In our view, we believe that costs for end investors to take liquidity will rise.
NYSE Research Insights
Find all of NYSE Research's articles on market quality, market structure, auctions, and options.