
October 29, 2018
In today's U.S. equities markets, roughly 60% of volume executes on an exchange and 40% executes off-exchange in dark pools and other broker-dealer facilities. All activity, both on and off exchange, relies on the quoted prices from exchanges to inform transaction pricing. This makes the National Best Bid and Offer (NBBO), reflecting the best quoted prices from all exchanges, a key benchmark for all types of trading, including midpoint trading leveraged by institutional investors and price improvement offered to retail investors. We have seen that the quality and quantity of quotes contributing to the NBBO can vary dramatically between exchanges, which we can measure using a new metric called "Enhanced Quoted Spread."
Quoted Spread & Exchange Competition
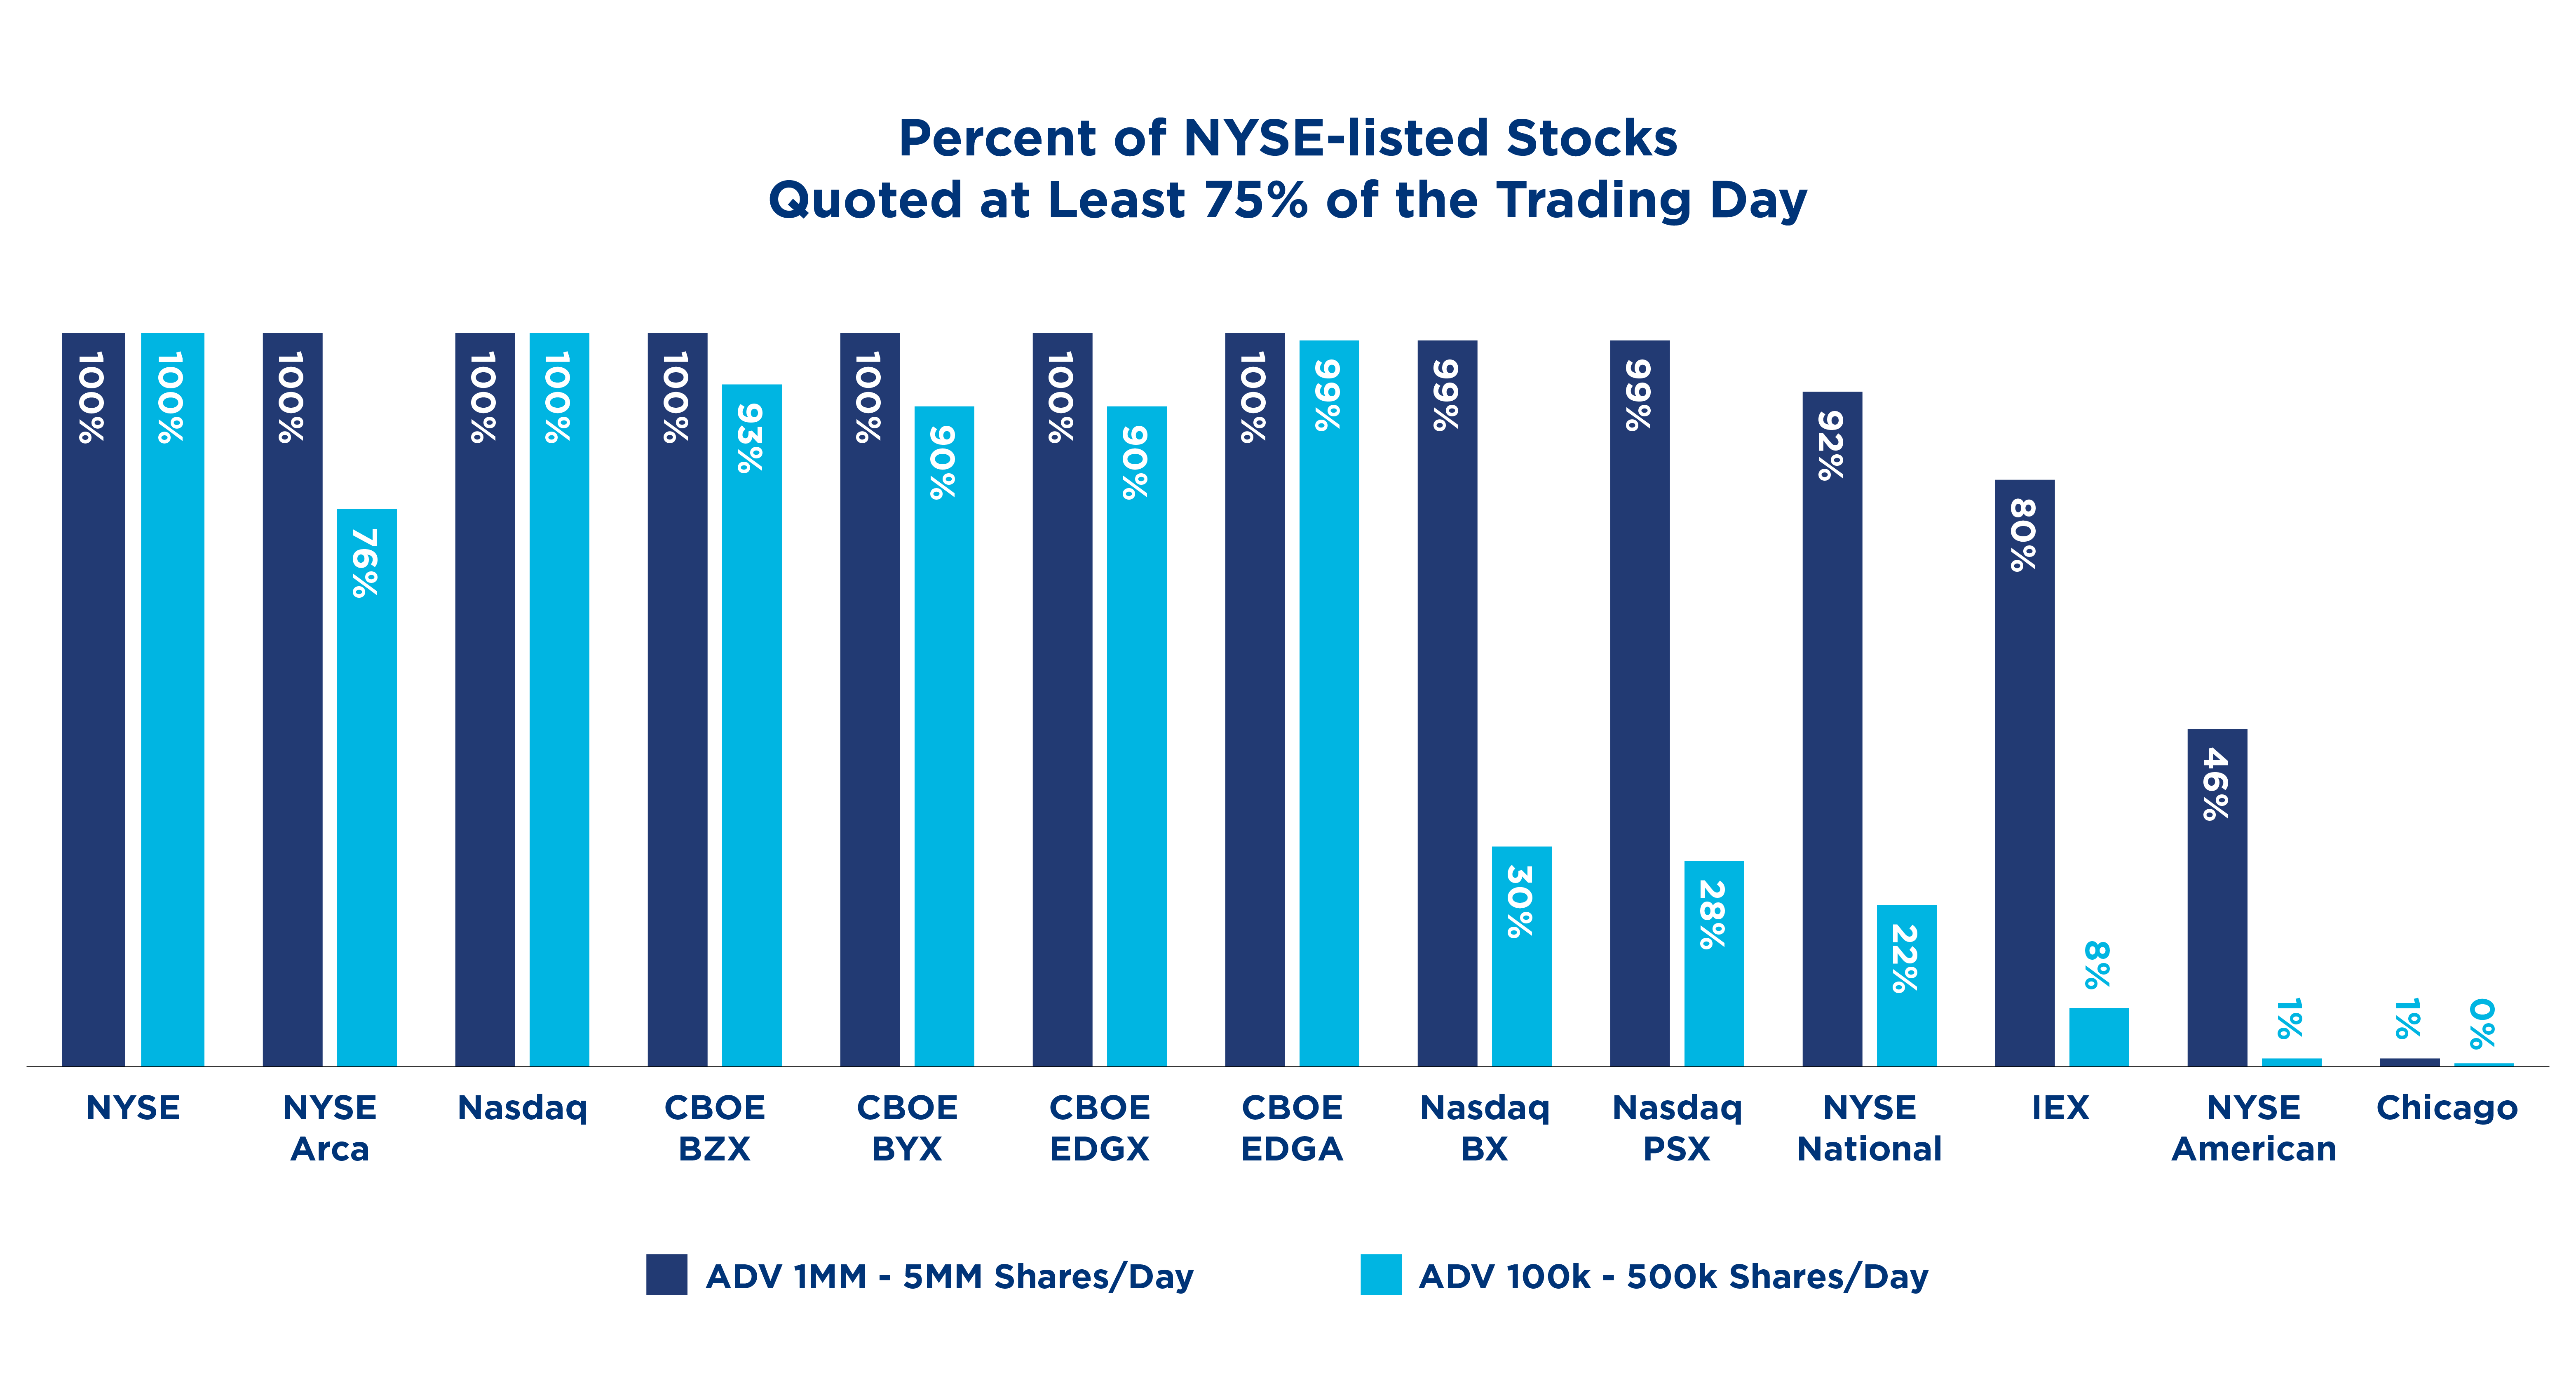
The NBBO that facilitates midpoint trading and retail price improvement arises from robust competition among exchanges to provide the highest bid and lowest offers for the longest portion of the day. One standard calculation for quoting performance is the exchange's average quoted spread. Taking a simple average of quotes published by an exchange, however, can hide an important fact: many exchanges offer two-sided quotes for only a small portion of the day in many stocks. This means that an exchange's "average" quoted spread may exist for only fleeting moments of the day, and market participants looking to execute on such an exchange may frequently find the venue does not offer a competitive quote (or sometimes any quote at all).
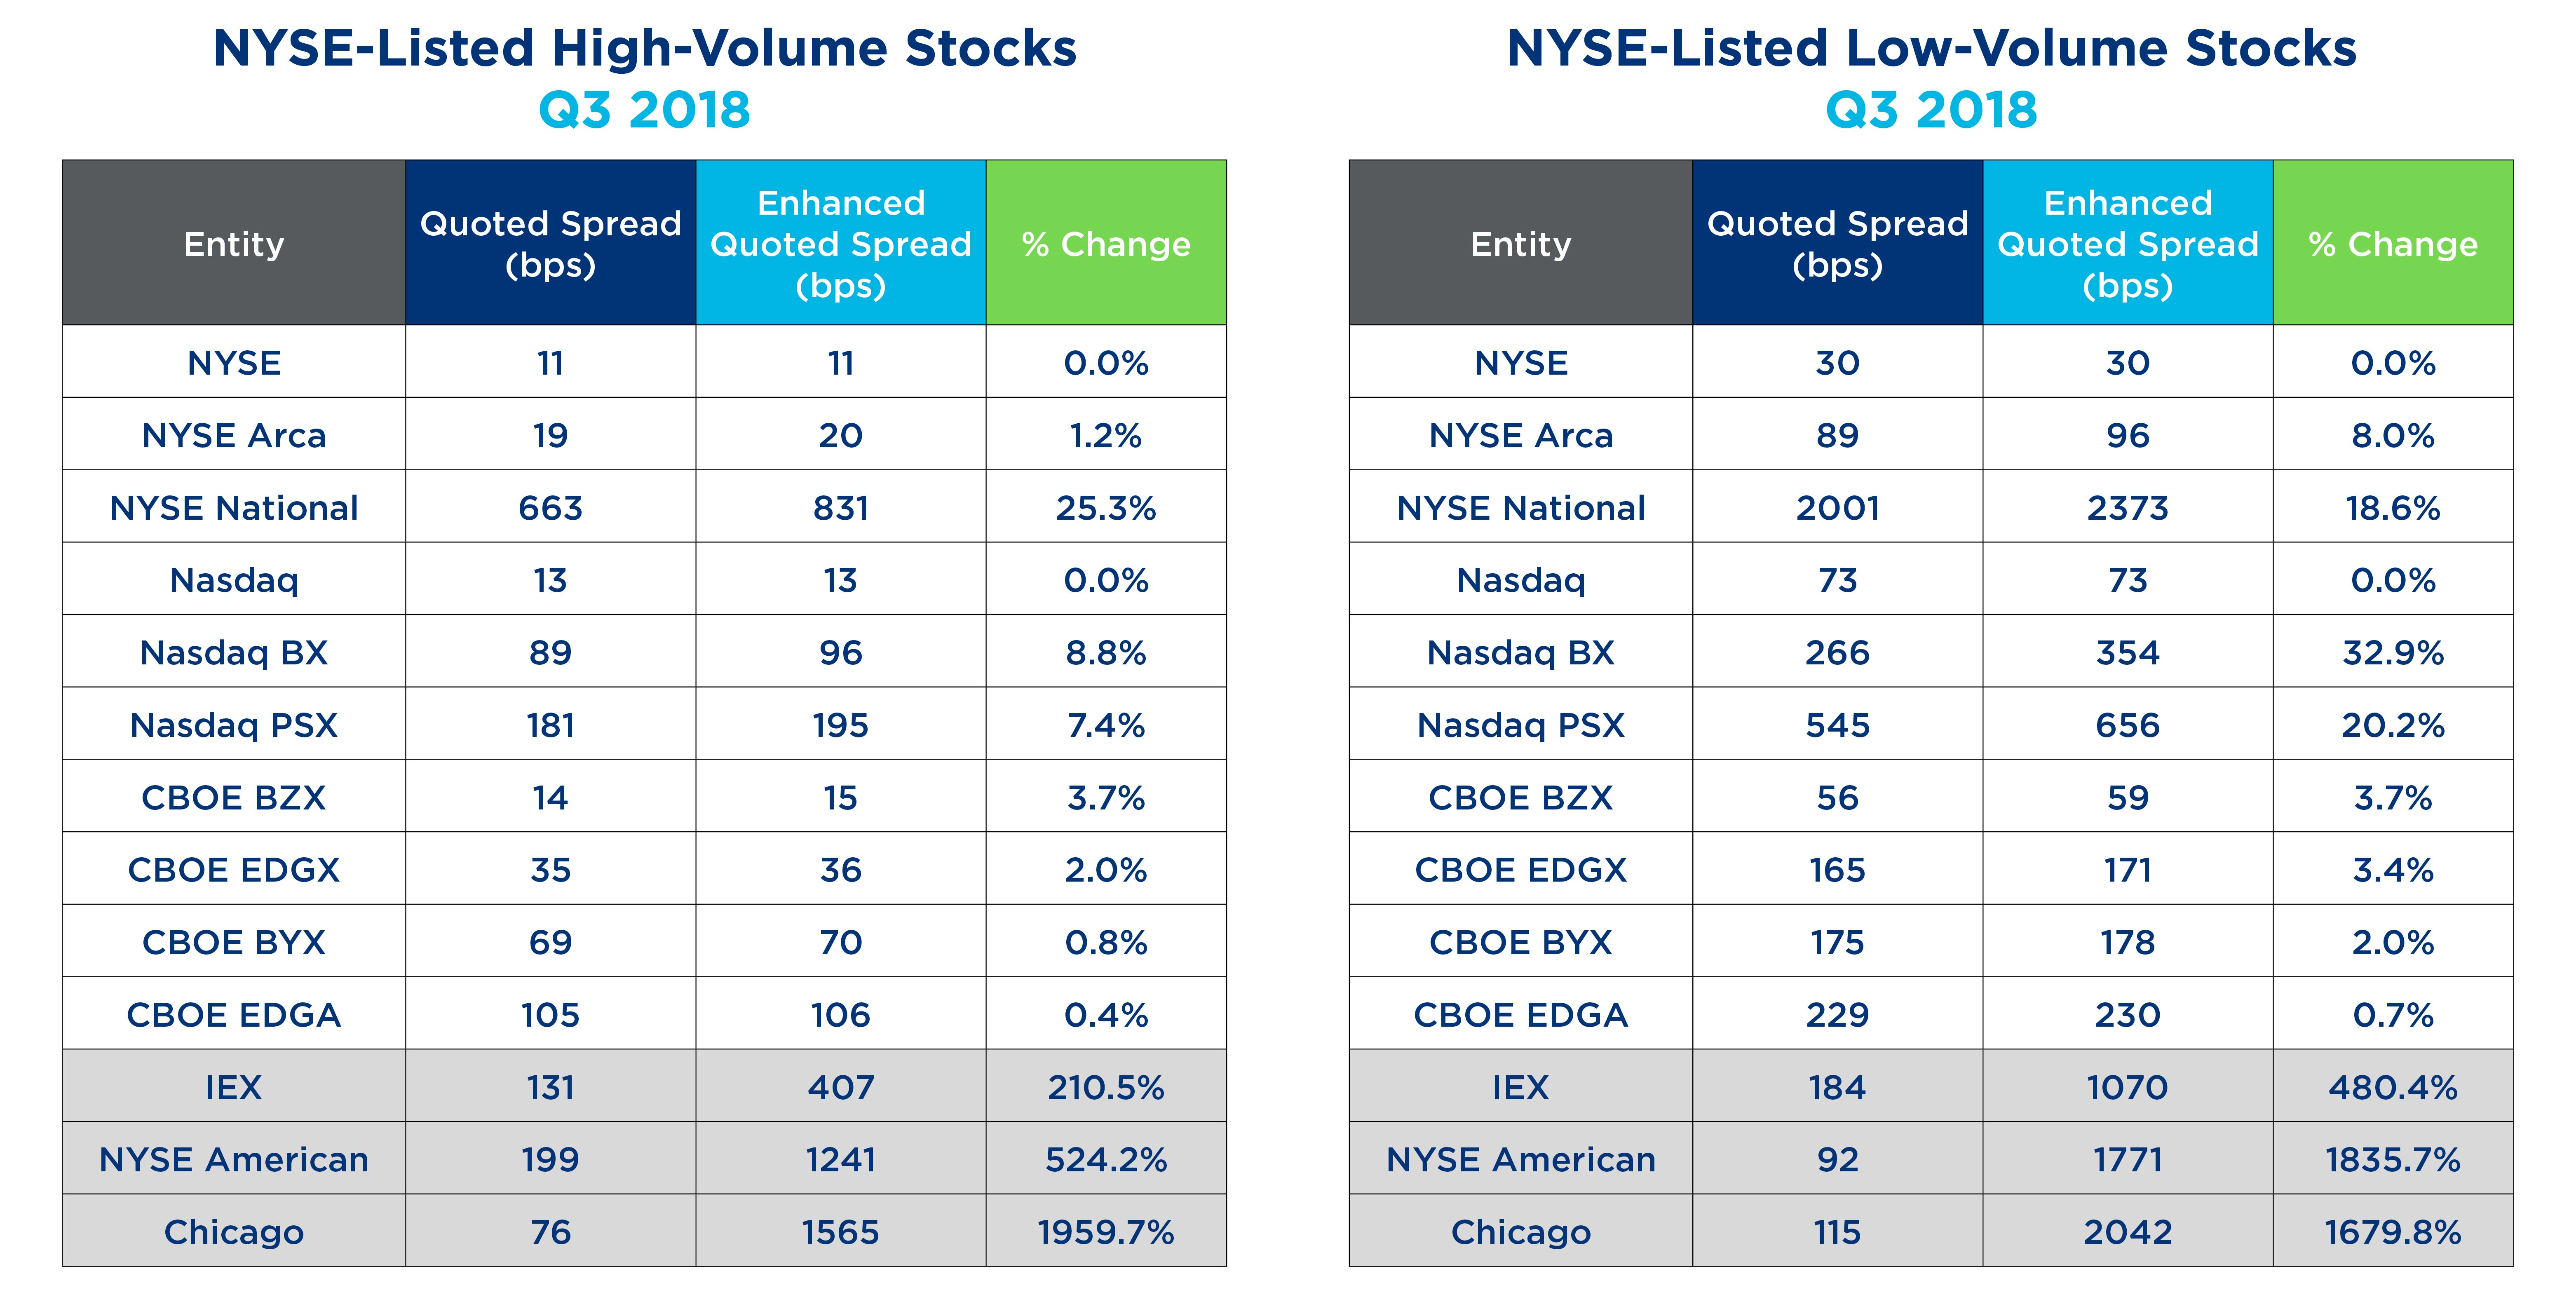
The Enhanced Quoted Spread (EQS) measure addresses this by replacing any missing quotes with the value of the Limit Up Limit Down (LULD) band.1 If an exchange has a one-sided quote, or no quote at all, we assign that exchange the LULD band price rather than drop the observation. With this method, exchanges with occasional or periodic quotes incur a penalty for their lack of displayed liquidity rather than misrepresenting a tight but infrequent displayed market as narrow on average.
The Cost of Not Showing Up
For many exchanges, the EQS calculation is similar to the average quoted spread calculation, especially in active stocks. For example, in active NYSE names, NYSE, NYSE Arca, and Nasdaq have nearly equal quoted spread and EQS calculations. However, exchanges with low market share and/or dark-oriented trading models fare worse under the EQS approach in both active and less-active stocks. For example, three venues exhibit EQS metrics of several times their standard quoted spread results, indicating they frequently have no displayed quote in the market.
So What?
As many investors have focused more attention on off-exchange trading, the exchange contribution to price formation has become frequently overlooked or even derided, even though off-exchange trades rely on exchange quotes to set prices. As the Enhanced Quoted Spread shows, contributions to price formation vary widely among exchanges. Maker/taker venues consistently outperform other venue types in both average quoted spread and in the EQS measure, suggesting that under today's market construct pricing incentives contribute positively to both the quality and reliability of displayed quotations.
1 The NYSE wishes to thank David Weisberger, who gave us the idea for this calculation.
Get NYSE's Data Insights
NYSE Research Insights
Find all of NYSE Research's articles on market quality, market structure, auctions, and options.