
The New York Stock Exchange is the world’s premier equity trading platform. Against both volatile and stable backdrops, data shows that stocks trade better on the NYSE. Our analysis demonstrates that even during the NYSE’s temporary Trading Floor closure, issuers and investors can rely on the innovation, stability and price discovery process of our platform.
Comprehensive Market Analysis
Investors know that all listing markets are not the same. There are significant differences in market models, especially as trading costs increase during volatile conditions.[1] To analyze these differences, it is critical to consider a broad, meaningful set of securities most relevant to issuers and investors.
Nasdaq recently published observations about the relative performance of the listing markets based on the average performance of S&P 500 constituents on a dollar weighted basis. AAPL, AMZN, FB, GOOG and MSFT represent more than 40% of the Nasdaq-listed dollar weighted constituents in the index. This is cherry picking data. By overemphasizing a handful of actively traded, high-priced securities, Nasdaq’s conclusions do not accurately reflect the broader trading landscape.
Chart 1: S&P 500 Value Traded
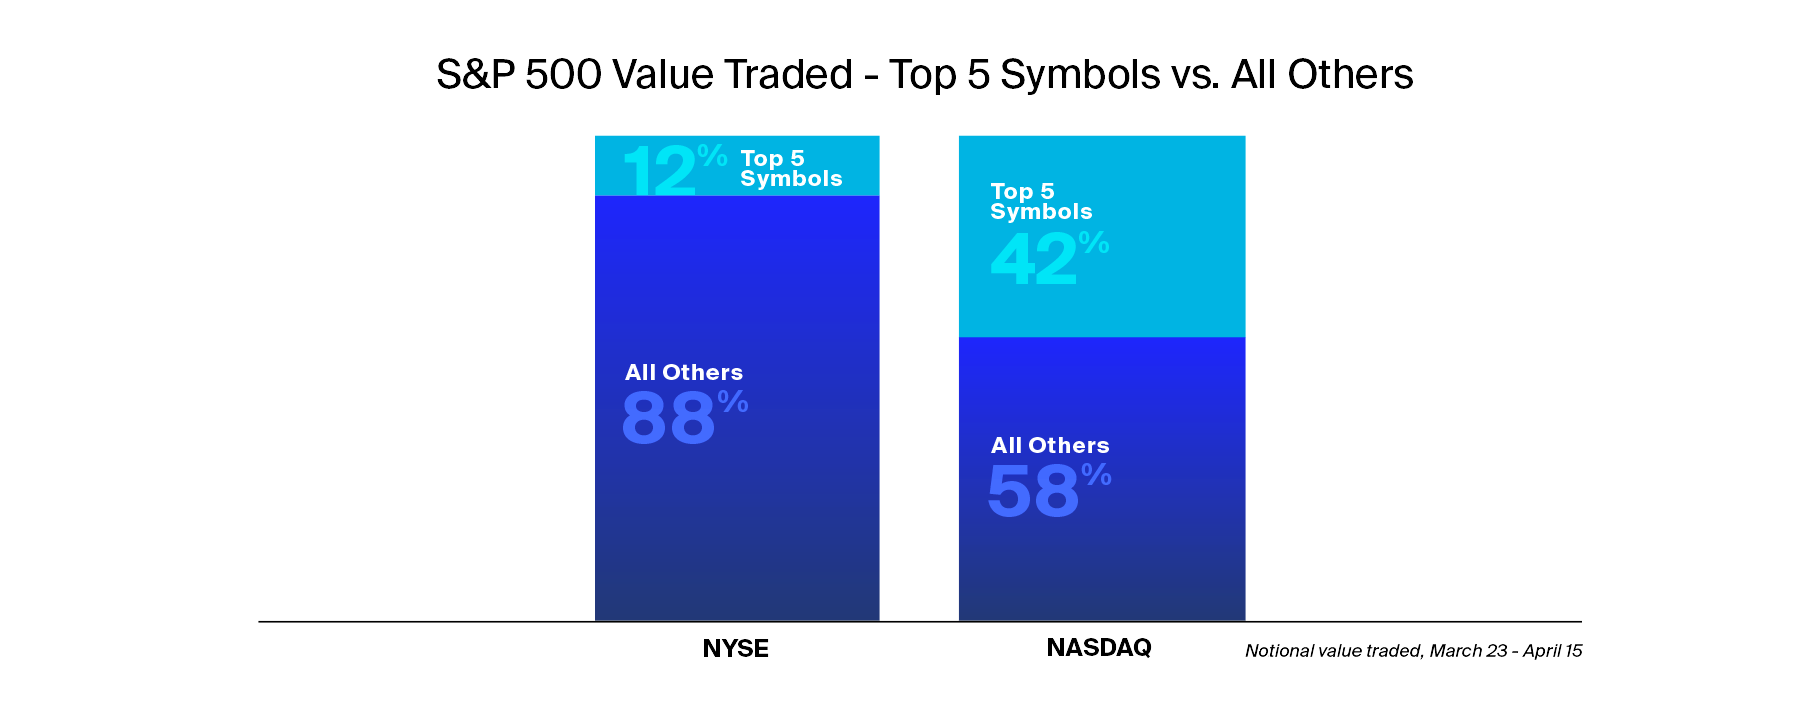
Five high priced stocks do not represent the entire U.S. equity market, but five stocks contribute to over 40% of Nasdaq’s recent trading analysis. In our research, we look at all U.S. corporate equity securities with a market cap above $500 million listed across the NYSE and Nasdaq markets. These are the stocks that investors own and trade.
The Temporary Shift to an All-Electronic NYSE
On March 23, the NYSE temporarily closed its Trading Floor in response to the COVID-19 pandemic. The fully operational NYSE - which offers the expertise, strategic order handling and pricing accuracy of the Trading Floor - is the gold standard for issuers and investors. The current all-electronic configuration lacks face-to-face interaction and Floor Broker specific order types, but maintains the obligations and accountability of NYSE Designated Market Makers (DMMs). Here, we review recent NYSE operations under both configurations, as well as 4Q2019 statistics to represent more stable trading conditions.
The Advantage of NYSE DMMs in Volatile Markets
NYSE DMMs are central to the floor-based model, combining human judgment with cutting-edge technology to provide superior market quality. DMMs have specific obligations and accountability designed to protect investors. They ensure consistent trading conditions, support issuers and maintain depth of order book liquidity across their portfolio of stocks.
Exchange models matter. Lower volatility is directly correlated to lower implicit trading costs. Investors benefit as the daily trading range of NYSE stocks is less volatile than Nasdaq securities.
Chart 2: NYSE Stocks Trade in Tighter Ranges
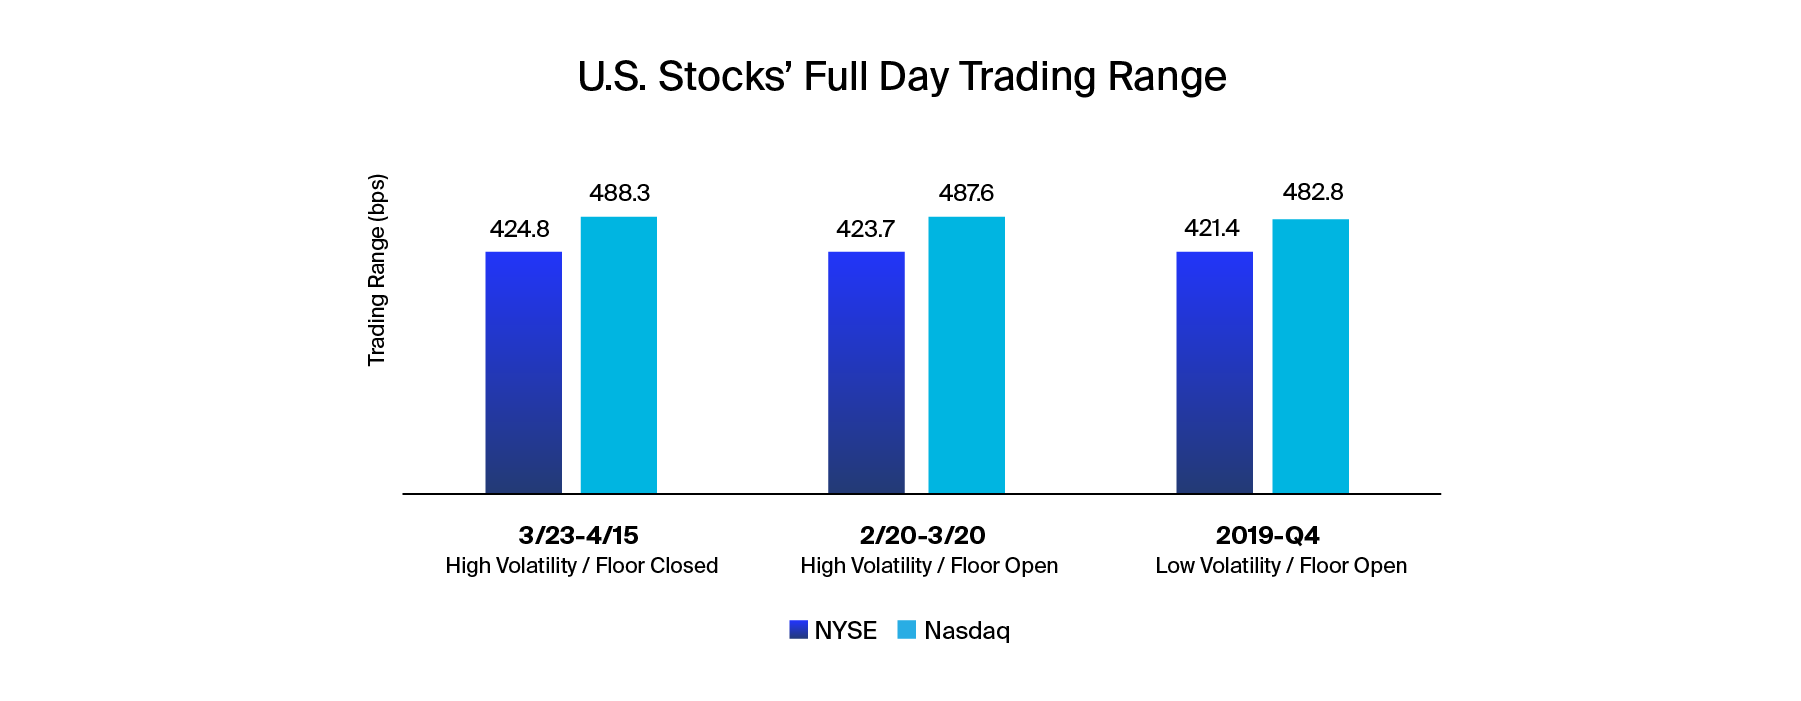
Note: Full Day Trading Range is the difference between the consolidated high price and low price for the trading day, divided by the average of the high and low price, in basis points. The data in all charts except Chart 5 are averages for all corporate securities with an end of 2019 market capitalization of at least $500 million.
- NYSE stocks are 50 to 65 bps less volatile than Nasdaq stocks across all market conditions.
- Superior technology helps control volatility. 2019 NYSE infrastructure upgrades have delivered more precise, actionable and durable quotes via increased bandwidth and more deterministic performance.
NYSE Tighter Bid / Offer Spreads Attract Institutional Investors
NYSE stocks trade with tighter spreads than Nasdaq-listed securities. When investors consider a position, the cost to enter and exit a stock can define returns. If a stock has a wider spread, it can create drag on portfolio returns and discourage institutional buyers.
Chart 3: NYSE Stocks Have Narrower Spreads
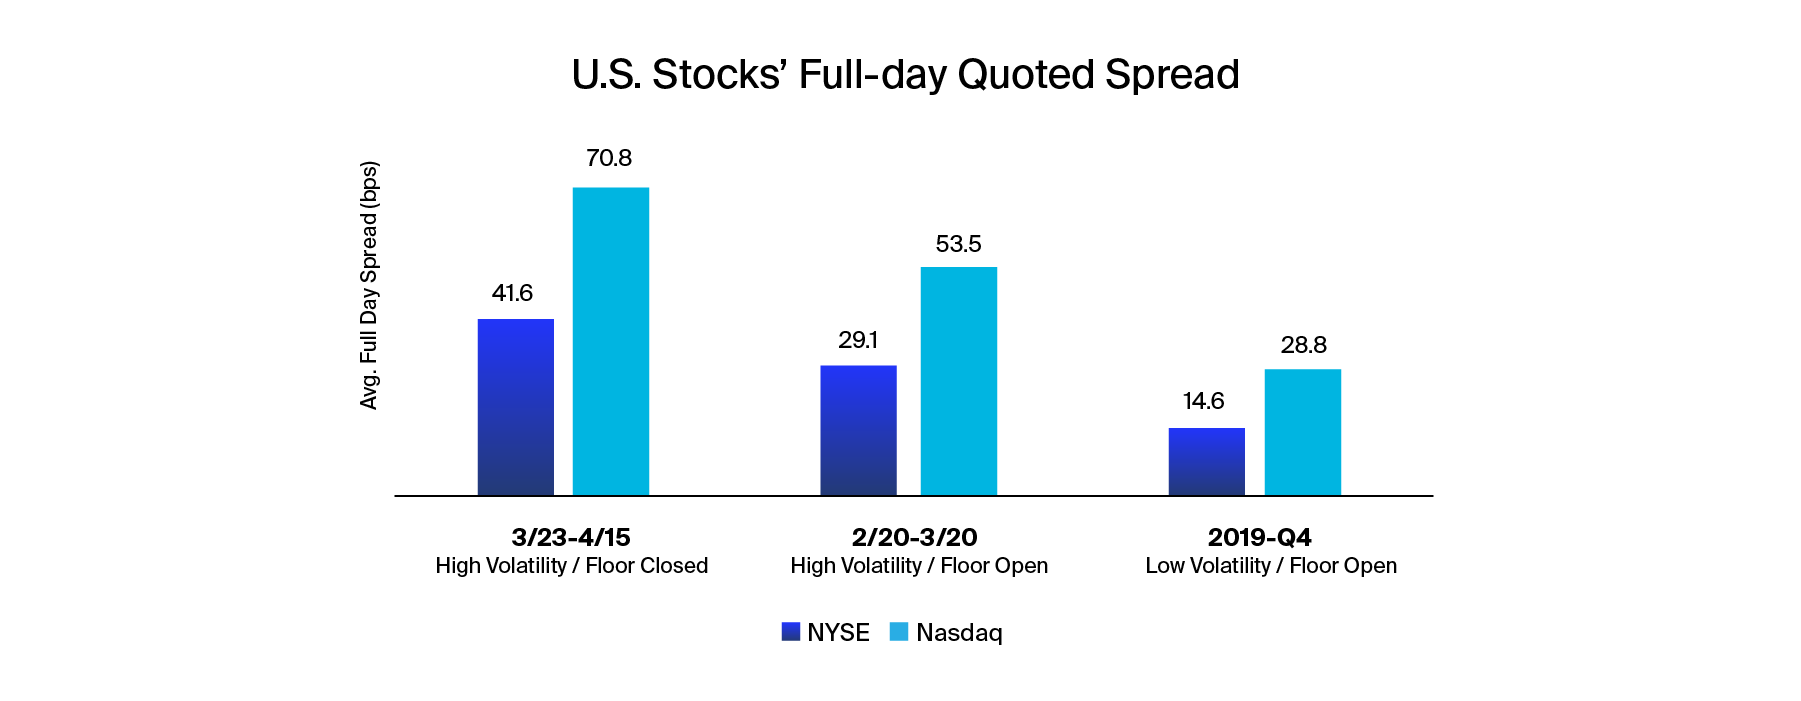
Note: This chart analyzes the average spread size of all corporate securities with a market cap above $500 million.
Note: Spreads are calculated as the time-weighted difference between the national best offer price - national best bid price divided by the average of the offer and bid price in basis points during regular trading hours (9:30AM - 4:00PM).
- Limiting spread costs are a core component of many trading strategies. NYSE stocks trade with smaller spreads.
- The NYSE full day average spread size was 46% smaller than Nasdaq in early weeks of the sell-off.
NYSE Excels into the Close
Over 20% of U.S. trading activity is executed in the final 30 minutes of the regular trading hours. NYSE Designated Market Makers’ regulatory obligation to provide liquidity at multiple price levels is a difference maker as the closing auction approaches.
Traders know larger quote size coupled with tighter spreads is a winning combination. The NYSE maintains a substantial advantage in dollar value available at the NBBO during the critical last 30 minutes of trading.
Chart 4: NYSE Stocks Offer More Late-Day Liquidity
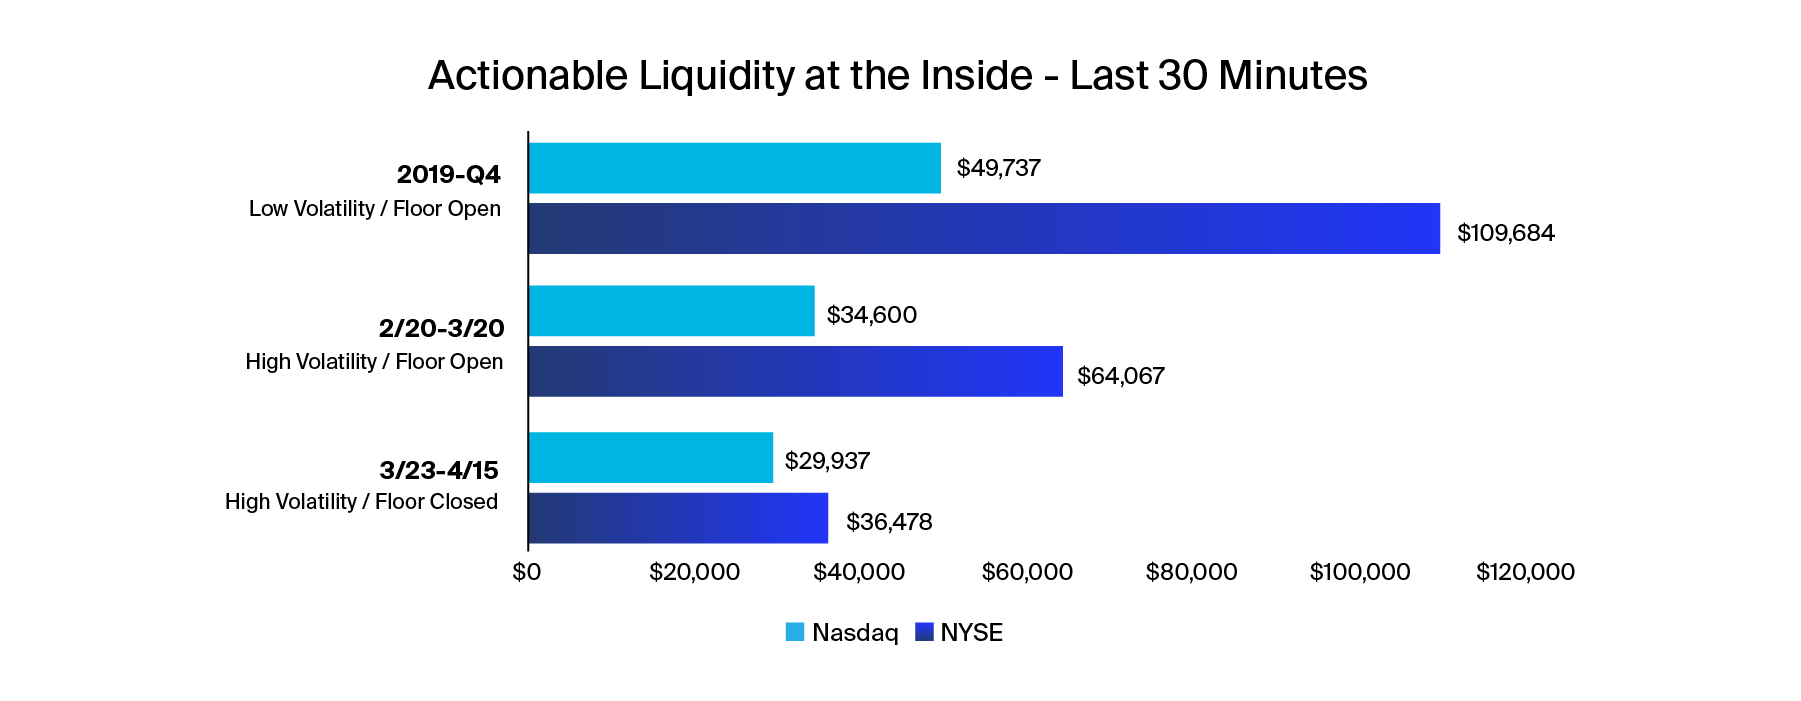
Note: Liquidity at the inside measures the average of the dollar value at the national best bid price and the national best offer price. We provide this data both for the full trading day (9:30AM - 4:00PM) and the last half hour of the trading day (3:30Pm - 4:00PM).
- Investors prefer to trade stocks with smaller spreads and meaningful liquidity on the quote.
- The NYSE average notional quote size is larger at the most essential points of the trading day under all market conditions.
The NYSE Closing Auction is the single largest global equities liquidity event each day. The NYSE establishes the official closing price via the intersection of unparalleled liquidity, innovative order types and the precision of the NYSE DMM toolkit. NAV calculations, derivative reference prices, index values and benchmark return strategies rely on our ability to close stocks at the right price.
Amid elevated volumes and volatility, many experts are studying the various exchange auction models. We look forward to their formal results. Preliminary feedback indicates the NYSE closing process is saving investors over $10 million dollars a day.
Trading Halts: In March 2020 NYSE Had Significantly Fewer LULD Halts
In March 2020, the U.S. Market Wide Circuit Breaker (MWCB) was triggered four times. In addition, a significant number of securities were halted due to stock-specific Limit Up/Limit Down (LULD) constraints. Volatility controls are important market safeguards, but excessively halting securities frustrates investor expectations of continuous liquidity and can distort the price discovery process.
The NYSE market model requires DMMs adhere to capital commitment guidelines which are far more demanding than the inconsequential quoting requirements for market makers on other exchanges. This heightened level of accountability served issuers well during the March sell-off and led to fewer LULD halts for NYSE-listed securities. In this chart, we expand our universe to analyze LULD statistics across all NYSE and Nasdaq-listed corporate securities.
Chart 5: NYSE Stocks Have Fewer LULD Halts
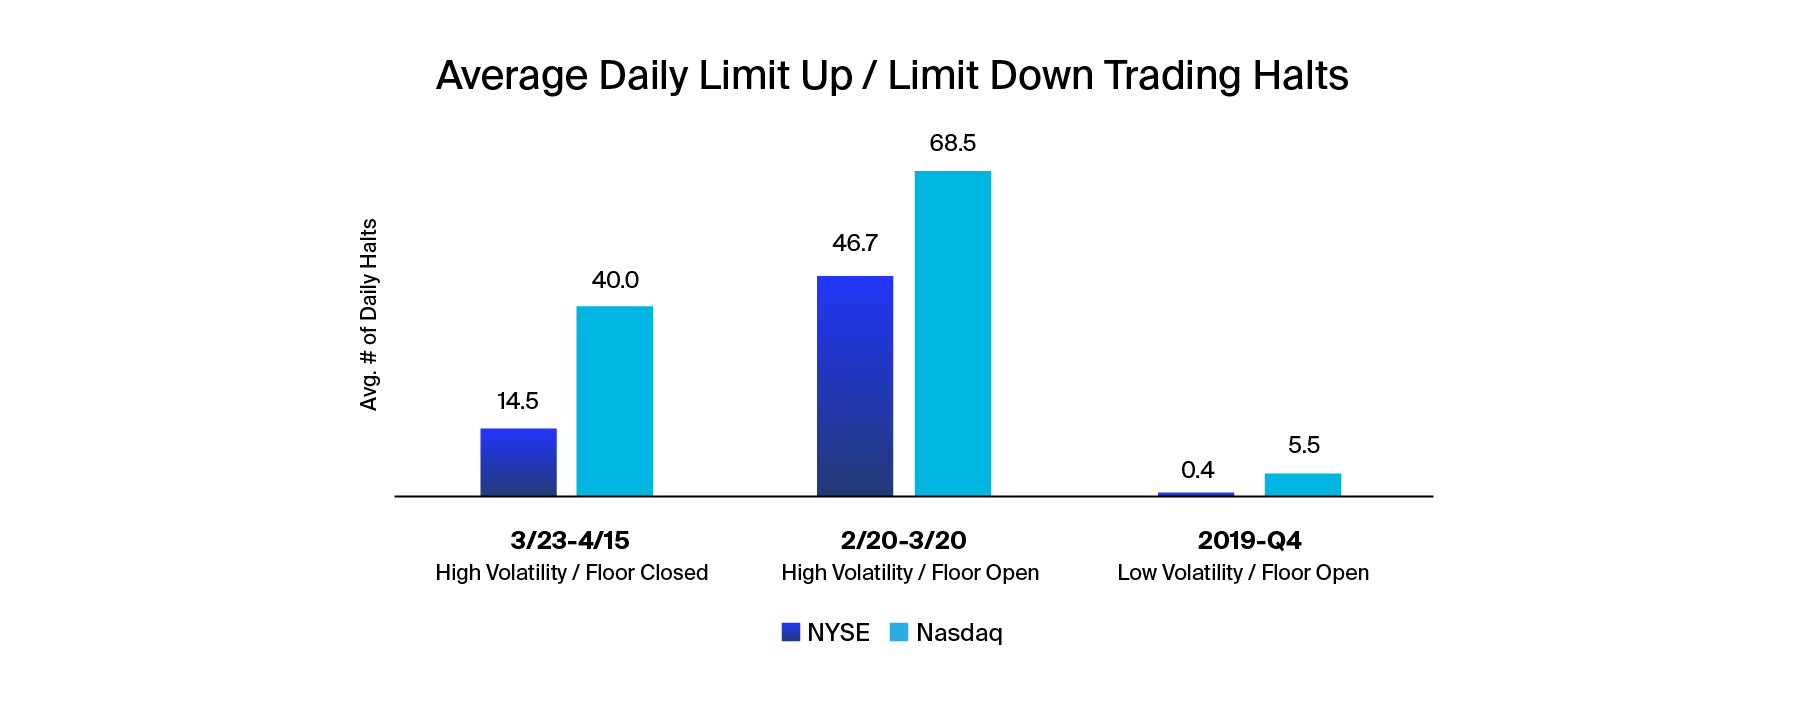
Note: Limit Up Limit Halt statistics include all corporate securities listed on the NYSE and NASDAQ
Now More Than Ever: Exchange Models Matter
Investors know stocks trade better on the NYSE. Across variable market conditions, the NYSE brings stability and price discipline to the trading process. Superior technology strengthened by human insight is putting quantifiable distance between the NYSE and competing equity markets. Data confirms the NYSE model saves issuers and investors money. We look forward to the return of the NYSE Trading Floor as we continue to drive positive outcomes across global capital markets.
[1] Source: https://www.thetradenews.com/virtu-financial-study-reveals-surge-trading-costs-globally-march/