Stocks trade better on the NYSE. Core components of the NYSE model are the accountability and specific obligations of the Designated Market Maker (DMM). Market-leading technology, DMM obligations to provide depth-of-book liquidity, and the unique capital formation tools provided by the Trading Floor intersect to create the highest quality equity marketplace in the world.
NYSE Tighter Bid / Offer Spreads Attract Institutional Investors
NYSE stocks trade with tighter spreads than Nasdaq-listed securities. When investors consider a position, the cost to enter and exit a stock can define returns. If a stock has a wider spread, it can create drag on portfolio returns and discourage institutional buyers.
U.S. Stocks’ Full Day Trading Range
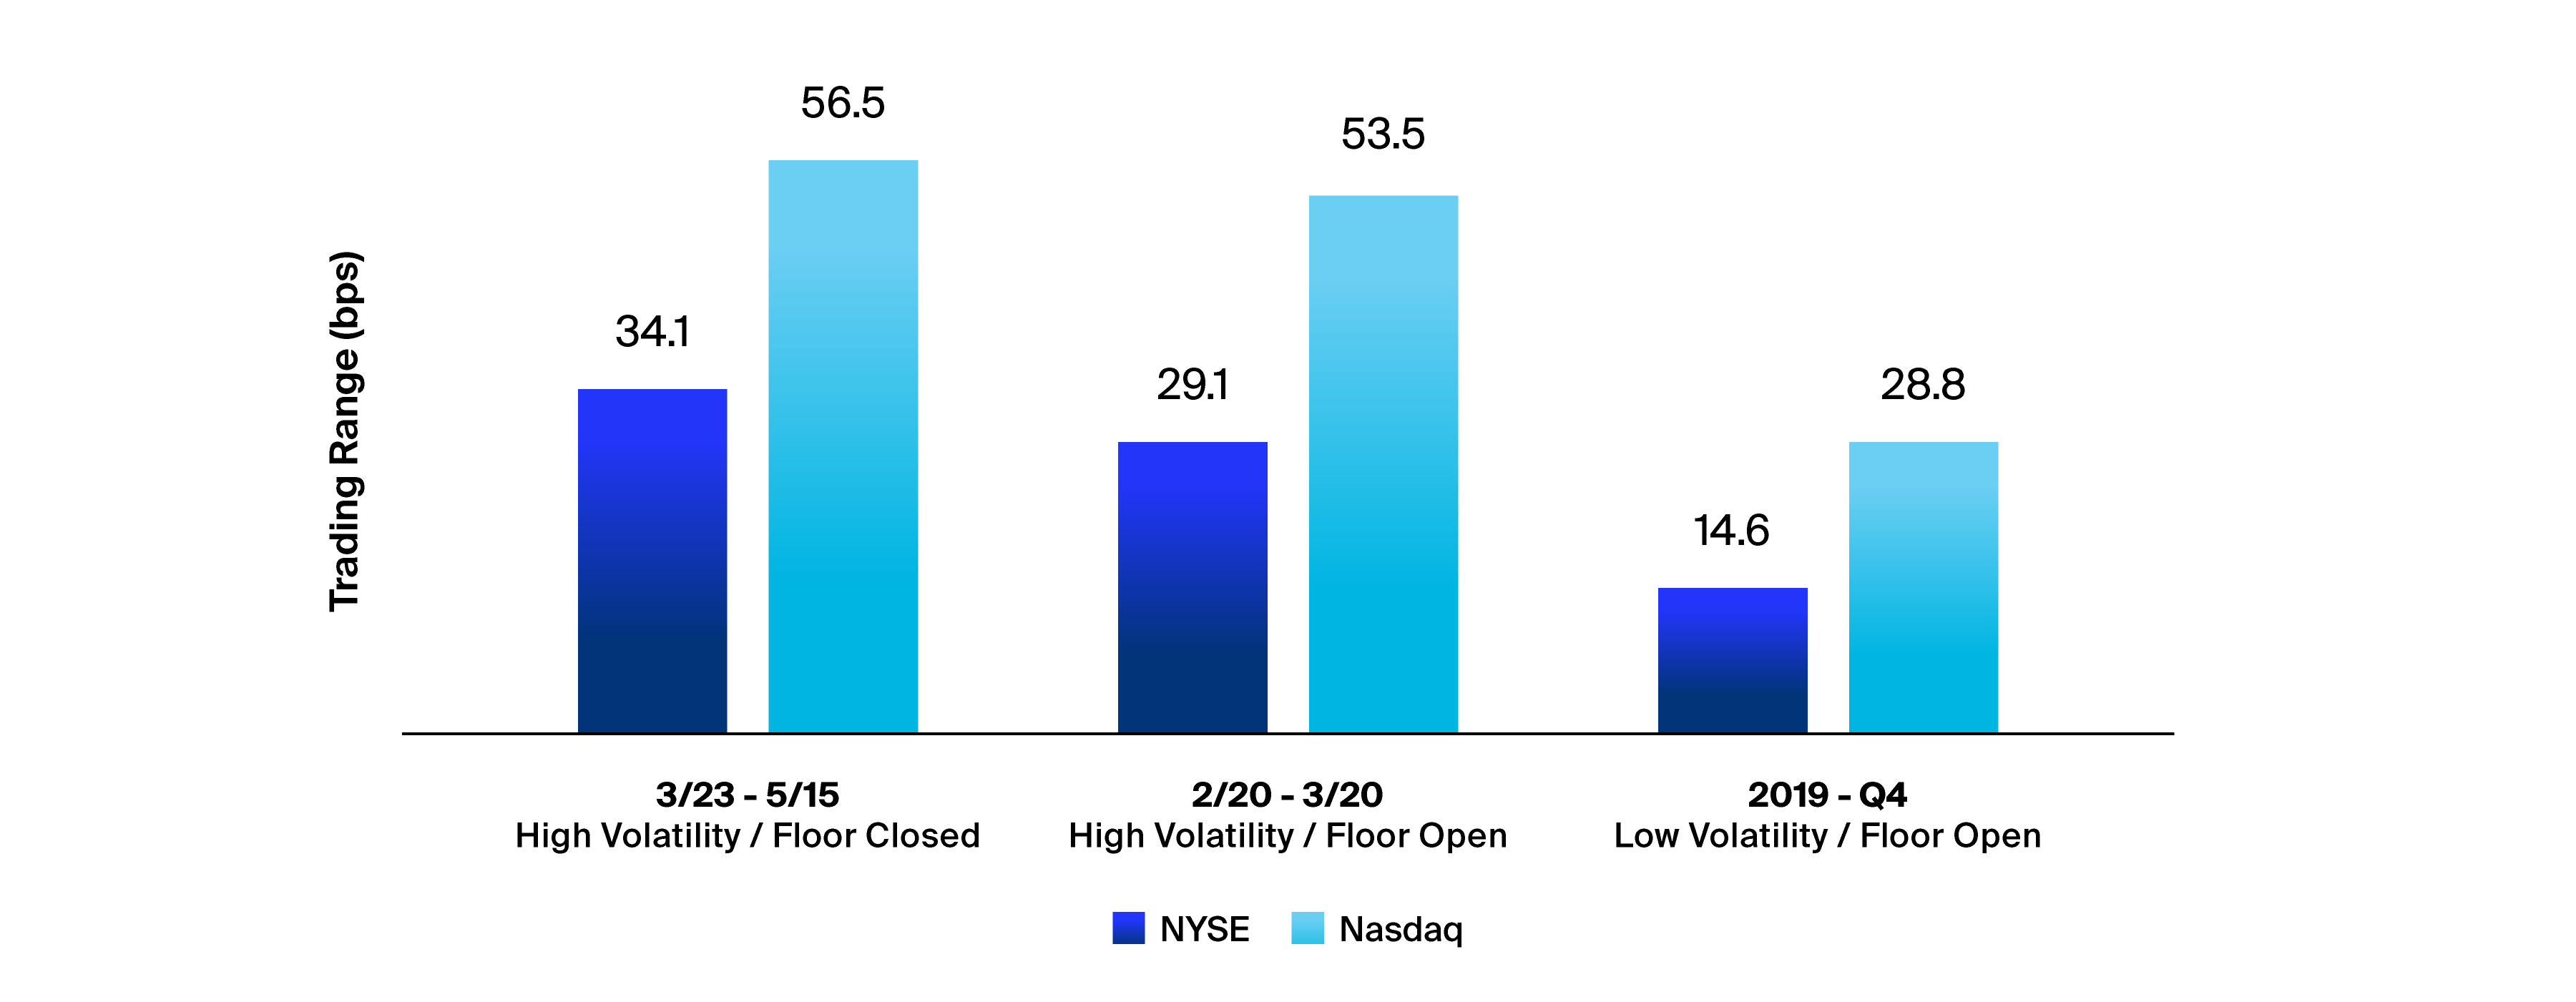
Note: This chart analyzes the average spread size of all corporate securities with a market cap above $500 million.
Note: Spreads are calculated as the time-weighted difference between the national best offer price – national best bid price divided by the average of the offer and bid price in basis points during regular trading hours (9:30 a.m. - 4 p.m.).
The NYSE Excels into the Close
Over 20% of U.S. trading activity is executed in the final 30 minutes of the U.S. trading session. The NYSE DMMs’ regulatory obligation to provide liquidity at multiple price levels is a differentiator as the closing auction approaches.
Traders know larger quote size coupled with tighter spreads is a winning combination. The NYSE maintains a substantial advantage in dollar value available at the NBBO during the critical last 30 minutes of trading.
Actionable Liquidity on the Inside - Last 30 Minutes
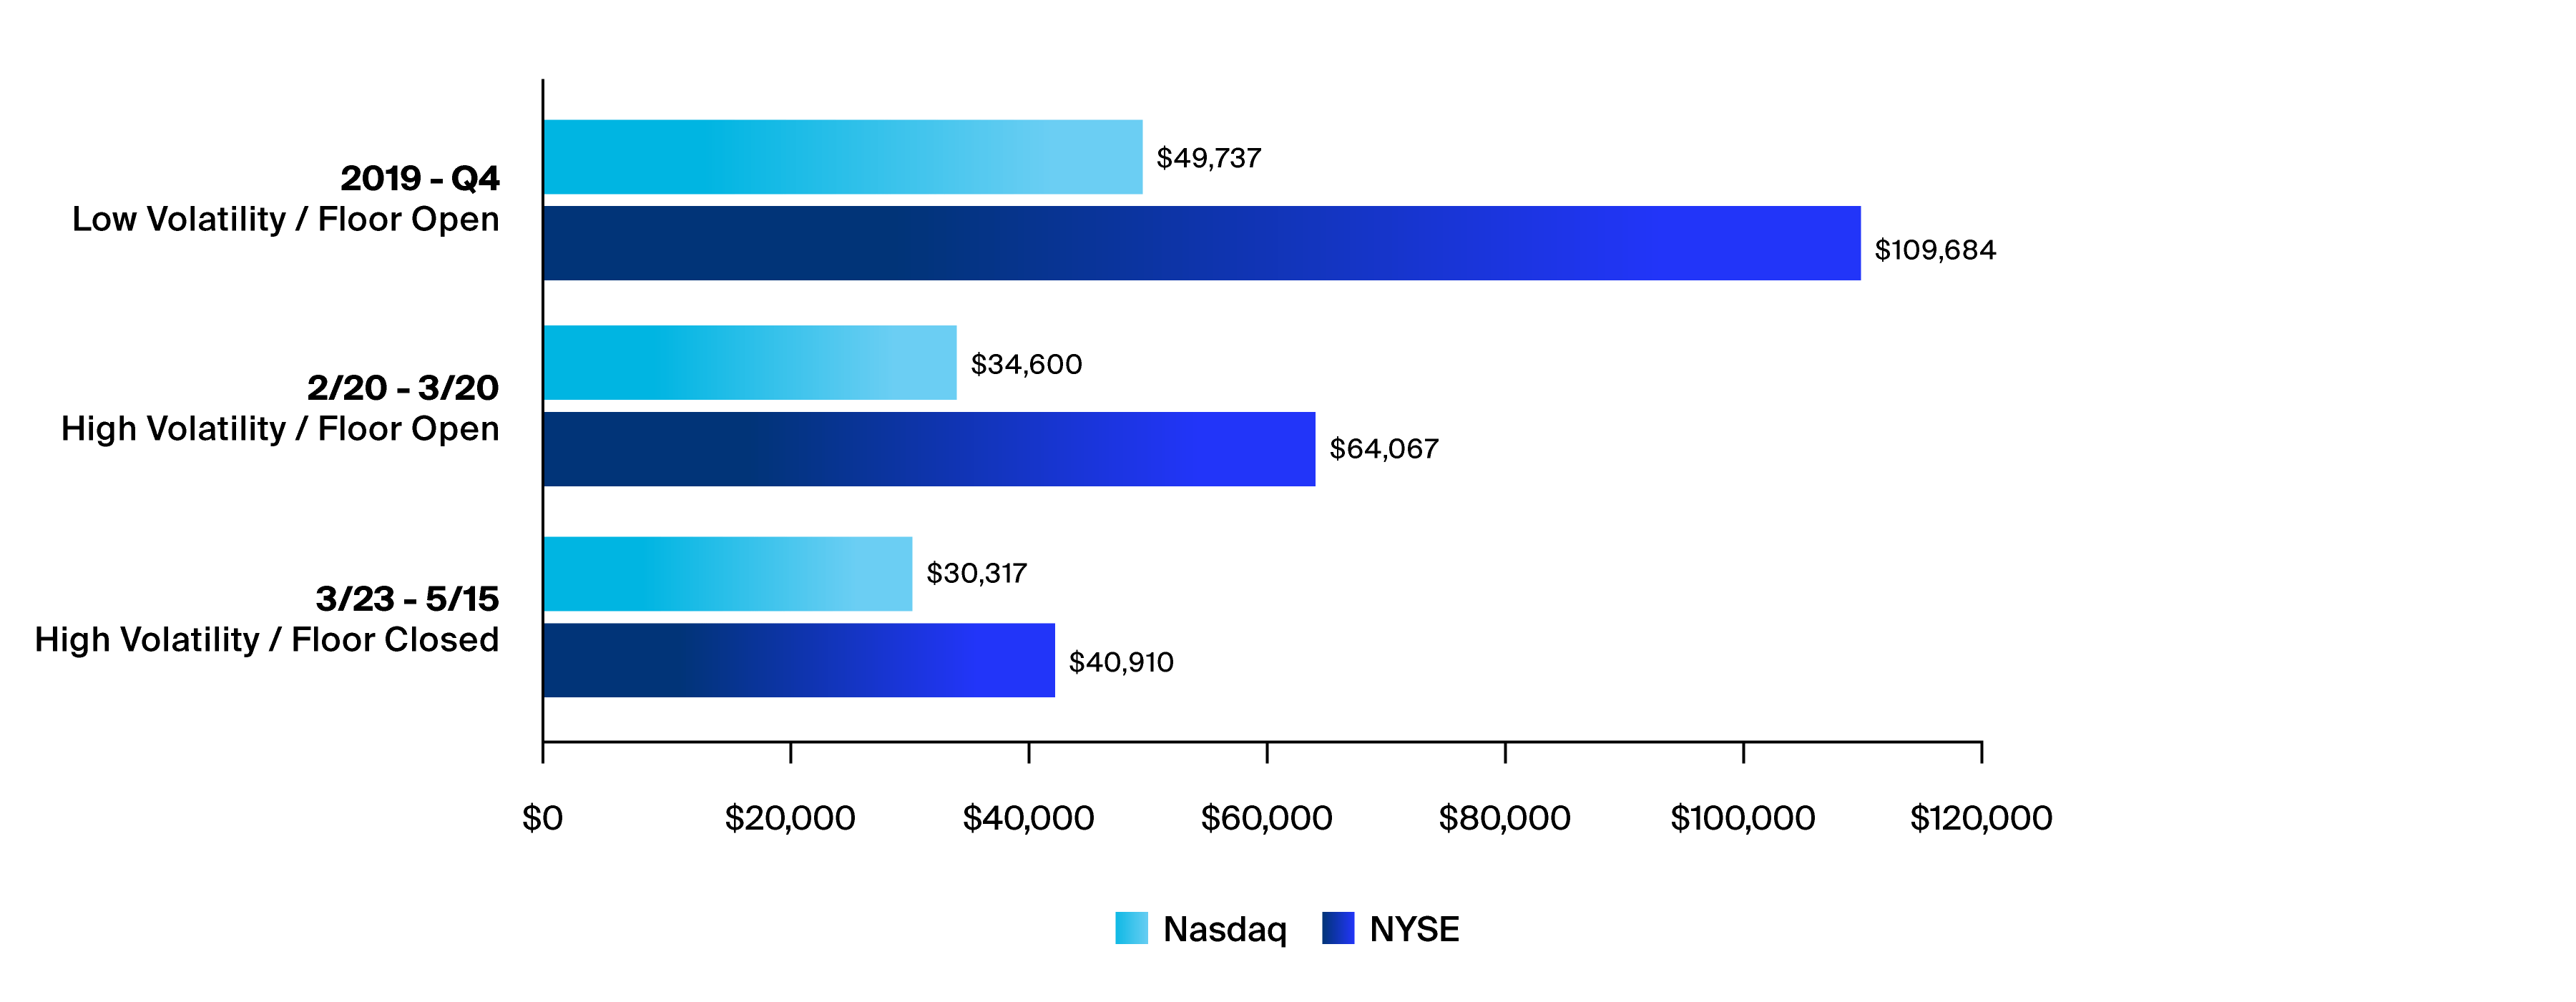
Note: : Liquidity at the inside measures the average of the dollar value at the national best bid price and the national best offer price. We provide this data both for the full trading day (9:30 a.m. – 4 p.m.) and the last half hour of the trading day (3:30 p.m. – 4 p.m.).
Note: This chart analyzes the average spread size of all corporate securities with a market cap above $500 million.
Pricing Follow-on Offerings Requires Precision
There is a significant difference in follow-on discount pricing between the NYSE and Nasdaq-listed securities. The chart below shows the historical median percentage discount to last sale by exchange. The NYSE outperforms.
Median Follow On Discount by Month 2020
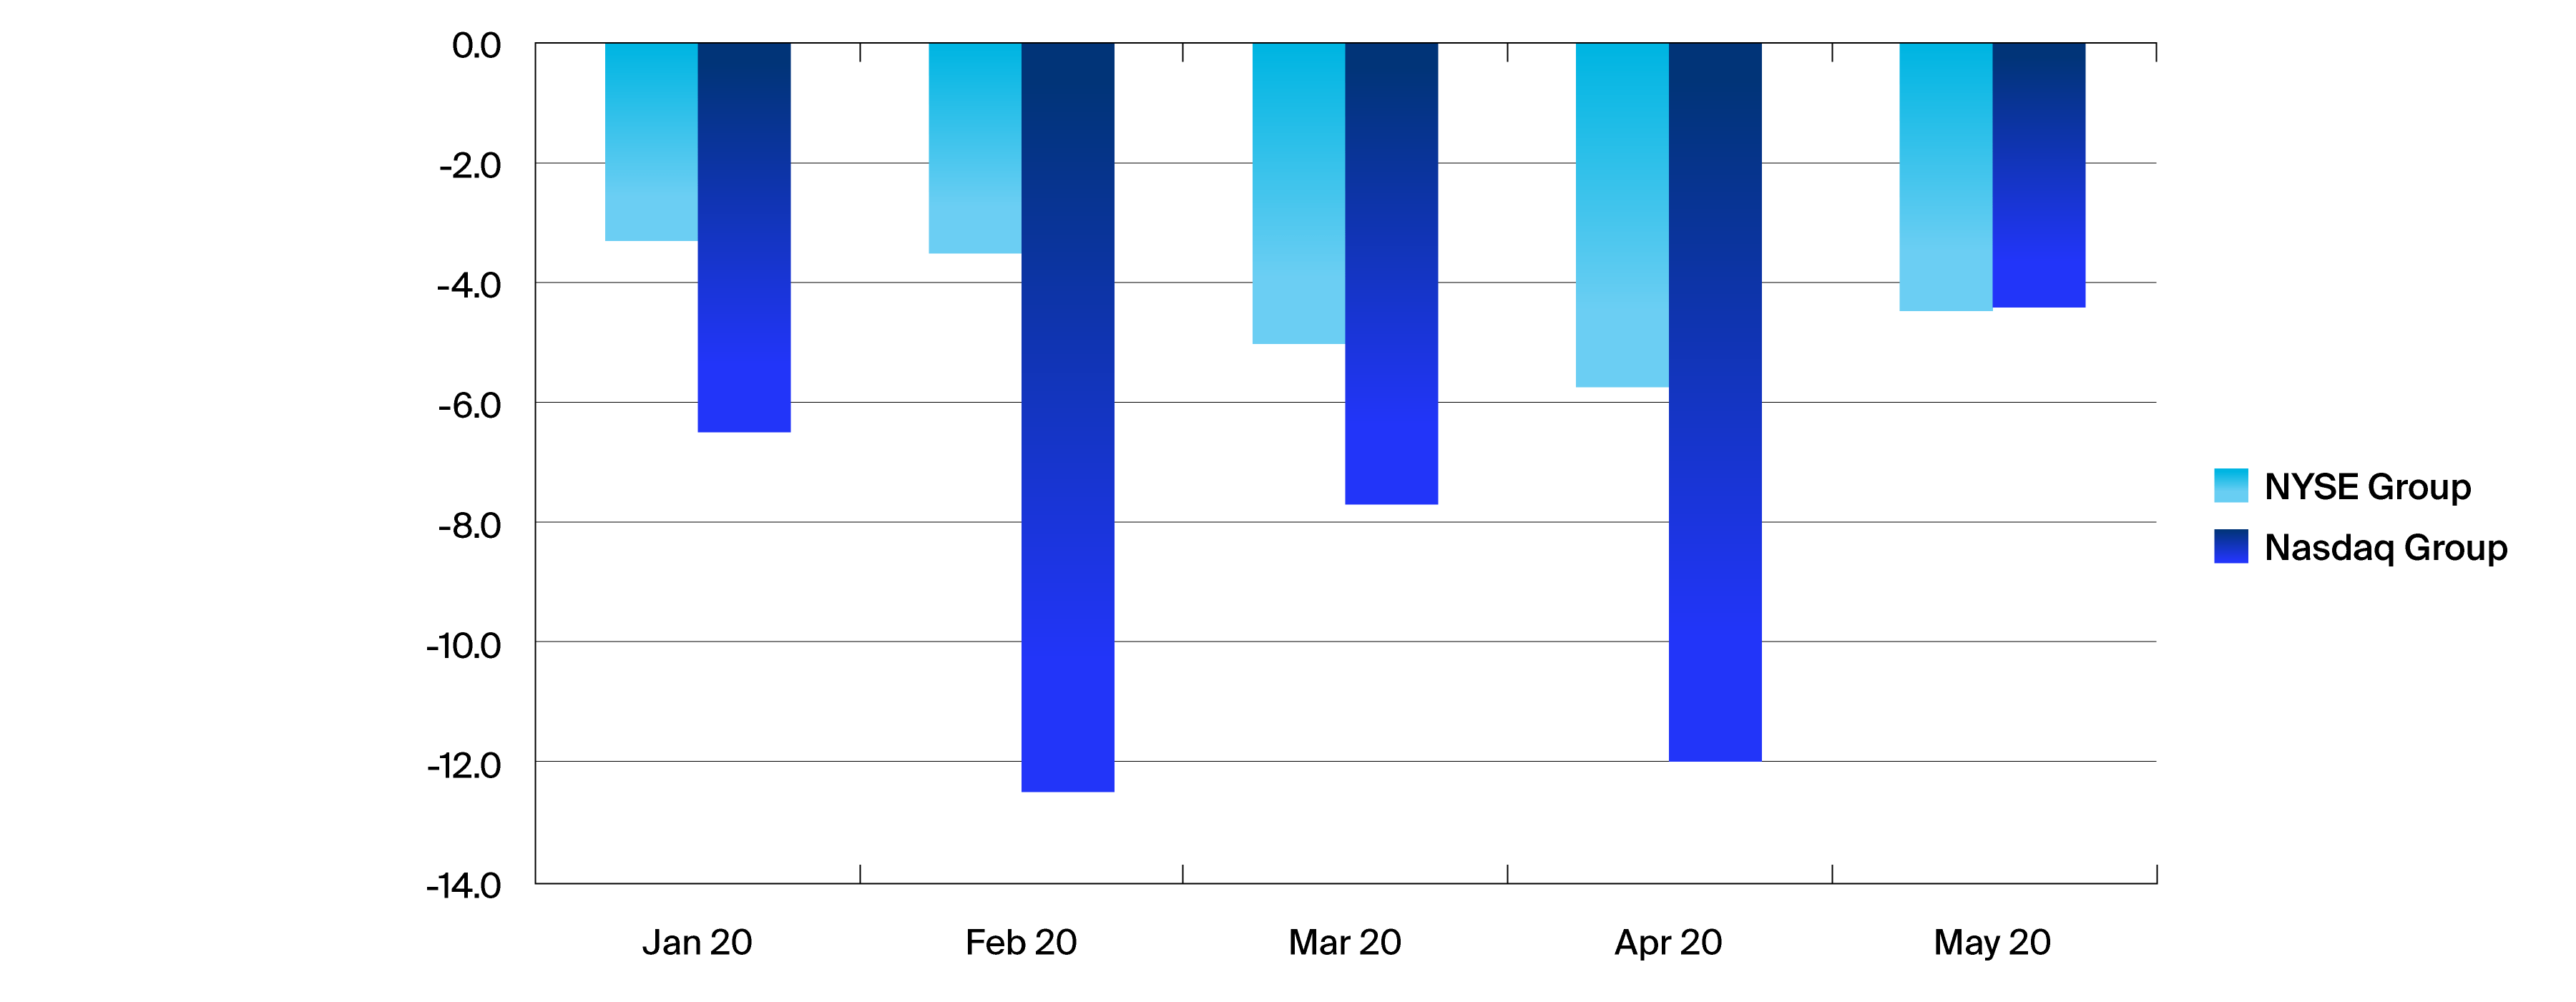
Source: IHS MARKIT