
Three Quarters of the Way There
October 19, 2021
As we enter the final stretch of 2021, let’s revisit the five bold predictions for active ETFs that the NYSE made at the beginning of the year:
- Assets under management (AUM): Grow from $172.8 billion at the start of the year to exceed $300 billion by year-end 2021.
- Full year cash flow: Leapfrog 2020’s record of $60 billion and rise to over $70 billion.
- Mutual fund to ETF conversions: 5+ issuers convert, totaling over $40 billion in AUM.
- Active semi-transparent: 25 ETFs will launch, and assets will exceed $2.5 billion.
- Growth milestone: At least 1 issuer will eclipse $50 billion in AUM.
How do these predictions stack up at the end of three quarters in 2021?
- Assets have grown to $275.9 billion, remaining in striking distance of $300 billion.
- Full year cash flow officially surpassed a record 2020 with $69.9 billion year-to-date (YTD), making our end-of-year prediction a near lock.
- Four separate issuers have launched 11 new active ETFs via conversion from legacy mutual funds, with combined assets of $37.9 billion. Based on the pipeline of public conversions, this will still come down to the wire.
- 22 new active semi-transparent assets came to market through Q3 and assets stand at $2.1 billion. The number of new ETFs is a near lock based on public filings, and total assets seems likely.
- ARK Invest lost ground on the march to the $50 billion club in Q3 and there is now a three-issuer race between First Trust ($42.8 billion), DFA ($39.9 billion) and ARK ($37.6 billion). Moral of the story, there is a lot riding on the final quarter of 2021.
Beyond our bold predictions, here are a few additional stats that continue to stand out to us:
- Firms with positive cash flow: 119 firms or roughly 95% of firms.
- ETFs with positive cash flow: 527 active ETFs or nearly 80% of all products.
- ETFs launched: 206 active ETFs launched through Q3, exceding 2020’s full year total of the 167 ETFs.
The Growth of Active ETFs
Despite a year-over-year drop in Q3, cash flow in the industry is $30 billion ahead of YTD 2020, with $69.9 billion in new flows. Equity flows continue to lead with $34.2 billion in flows. Notably, domestic-oriented strategies surpassed their global counterparts for the first time in two years and are on track to have a record year. Region agnostic, thematic ETFs (i.e., Innovation, Robotics, Future Health, etc.) continue to lead the way, followed by large cap core and dividend-focused style ETFs as well as ESG strategies. Fixed income flows, at $26.2 billion, gained back share during Q3, with flows favoring high yield and senior loan portfolios as well as ultra and short-term ETFs. Commodities quietly continue their momentum, with $7.1 billion in flows led by broad commodity strategies.
Active ETF Fund Flows by Asset Class
At the issuer level, ARK led Q3 outflows with $4.7 billion, but maintains the YTD industry lead with $10.9 billion in new flows. Behind them sits JPMorgan, which led Q3 inflows with $3.7 billion and whose YTD flows total $9.5 billion. Its success is driven by a combination of steady growth in the domestic fixed income business and rising strength in the equities business. Rounding out the top five are First Trust ($8.3 billion), State Street ($5.7 billion) and Blackrock/iShares ($5.6 billion). Collectively, the top five issuers accounted for 47% of cash flow — 13% lower than at the end of the first half of 2021.
% Flows Going to Top 5 Issuers by AUM
Across the industry, nearly 95% of issuers experienced positive cash flow through Q3, over 50% saw inflows exceeding $100 million and over 15% surpassed $1 billion. American Century ($3.5 billion), Dimensional/DFA ($2.7 billion), Quadratic ($2.5 billion), Invesco ($2.4 billion), Amplify ($1.7 billion), PIMCO ($1.2 billion), AdvisorShares ($1.2 billion), Innovator ($1.2 billion), ETC ($1.1 billion) and Fidelity ($1.0 billion) all surpassed the $1 billion cash flow mark. Other notables include KraneShares ($0.77 billion, 2020 entrant), Horizon Kinetics ($0.68 billion, first time issuer & 2021 entrant), and Simplify ($0.56 billion, first time issuer & 2020 entrant). During Q3, 75% of issuers experienced positive cash flow and 55% saw year over increases.
| Ticker | Top 10 ETFs by Cash Flow ($B) | YTD 2021 ($M) |
|---|---|---|
| SRLN | SPDR Blackstone Senior Loan ETF | $5,465 |
| ARKK | ARK Innovation ETF | $5,255 |
| JEPI | JPMorgan Equity Premium Income ETF | $3,655 |
| JPST | JPMorgan Ultra-Short Income ETF | $2,850 |
| IVOL | Quadratic Interest Rate Volatility & Inflation Hedge ETF | $2,501 |
| COMT | iShares U.S. ETF Trust iShares GSCI Commodity Dynamic Roll Strategy ETF | $2,306 |
| ARKG | ARK Genomic Revolution ETF | $2,014 |
| PDBC | Invesco Optimum Yield Diversified Commodity Strategy No K-1 ETF | $1,864 |
| ARKF | ARK Fintech Innovation ETF | $1,650 |
| FPE | First Trust Preferred Securities & Income ETF | $1,625 |
| Ticker | Top 10 ETFs by Cash Flow ($B) | Q3 2021 ($M) |
|---|---|---|
| JEPI | JPMorgan Equity Premium Income ETF | $2,021 |
| SRLN | SPDR Blackstone Senior Loan ETF | $1,498 |
| JPST | JPMorgan Ultra-Short Income ETF | $1,095 |
| FPE | First Trust Preferred Securities & Income ETF | $606 |
| FTSL | First Trust Senior Loan Fund | $387 |
| MINT | PIMCO Enhanced Short Maturity Active ETF | $385 |
| JMST | JPMorgan Ultra-Short Municipal Income ETF | $352 |
| PULS | PGIM Ultra Short Bond ETF | $339 |
| KRBN | KraneShares Global Carbon ETF | $332 |
| DFAC | Dimensional U.S. Core Equity 2 ETF | $294 |
| Ticker | Bottom 10 ETFs by Cash Flow | YTD 2021 ($M) |
|---|---|---|
| ARKW | ARK Next Generation Internet ETF | $(738) |
| FTSM | First Trust Enhanced Short Maturity ETF | $(199) |
| AWTM | Aware Ultra-Short Duration Enhanced Income ETF | $(152) |
| PDEC | Innovator S&P 500 Power Buffer ETF - December | $(131) |
| DJAN | FT Cboe Vest U.S. Equity Deep Buffer ETF - January | $(113) |
| GSY | Invesco Ultra Short Duration ETF | $(112) |
| ULTR | IQ Ultra Short Duration ETF | $(78) |
| VNLA | Janus Henderson Short Duration Income ETF | $(72) |
| PJAN | Innovator S&P 500 Power Buffer ETF - January | $(69) |
| LMBS | First Trust Low Duration Opportunities ETF | $(67) |
| Ticker | Bottom 10 ETFs by Cash Flow | Q3 2021 ($M) |
|---|---|---|
| ARKK | ARK Innovation ETF | $(2,387) |
| ARKG | ARK Genomic Revolution ETF | $(793) |
| ARKW | ARK Next Generation Internet ETF | $(772) |
| LMBS | First Trust Low Duration Opportunities ETF | $(479) |
| ARKF | ARK Fintech Innovation ETF | $(445) |
| PDBC | Invesco Optimum Yield Diversified Commodity Strategy No K-1 ETF | $(430) |
| ARKQ | ARK Autonomous Technology & Robotics ETF | $(311) |
| FLTB | Fidelity Limited Term Bond ETF | $(129) |
| IVOL | Quadratic Interest Rate Volatility & Inflation Hedge ETF | $(118) |
| VNLA | Janus Henderson Short Duration Income ETF | $(108) |
At the product level, 80% of active ETFs saw positive flows and 60% experienced positive cash flows during Q3. Quarter-over-quarter, 40 additional ETFs exceeded $50 million in cash flow (often viewed as a break-even measure for an ETF), bringing the total to 170, or 25% of all active ETFs.
YTD Flows by ETF Age
An analysis of ETF age (time since launch date) and YTD product-level cash flow revealed that flows are mainly concentrated in ETFs that are less than three years old. These ETFs attracted nearly 45% of cash flows, with ETFs that are less than one year old accounting for over 15%. This seems to call into question the adage that an active ETF requires a three-year performance track record to find success and serves as a kudos to product development teams across our growing industry.
In the final quarter of the year, in addition to keeping an eye on our bold predictions for 2021, we will be monitoring and discussing how distribution dynamics are evolving across the industry as well as the growth of semi-transparent strategies and potential for expansion into new asset classes.
Launch Monitor - End of Q3 2021
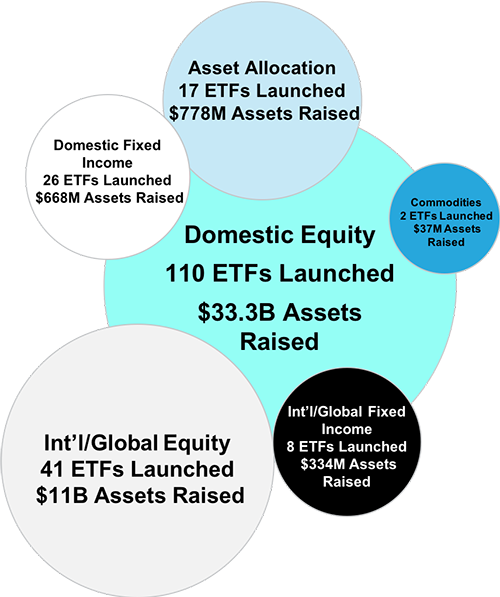
Source: FactSet as of 9/30/2021
Active ETF Stat Pack
| Firms | |||
|---|---|---|---|
| # of Issuers | 136 | ||
| # of New Issuers 2021 | 43 | ||
| Products | Assets | ||
| # of ETFs | 671 | AUM ($B) | $275.97 |
| # of New Launches 2021 | 207 | 3 Yr AUM CAGR | 164% |
| Avg. ER | 0.50% | 5 Yr AUM CAGR | 61% |
| Cash Flow | Trading | ||
| YTD Cash Flow ($B) | $69.70 | YTD ADV (Shares) | 58,407,458 |
| 3 Yr Cash Flow | $163.80 | YTD ADV ($) | $3.47 B |
| 5 Yr Cash Flow | $201.00 | YTD Avg. Spread (bps)* | 31.27 |
Source: Factset & NYSE Internal Database and Consolidated Tape Statistics as of 9/30/2021
*Simple average
Active, Semi-Transparent Update
| Ticker | Inception | Name | AUM | YTD Cash Flow | 30-Day Med. Spread (bps) | ADV (shares) | Structure | LMM | Expense Ratio |
|---|---|---|---|---|---|---|---|---|---|
| EQOP | 09/17/2020 | Natixis U.S. Equity Opportunities ETF | $10,154,366 | $(4,230,752) | 16.46 | 739 | NYSE AMS | Citadel | 0.90% |
| VNSE | 09/17/2020 | Natixis Vaughan Nelson Select ETF | $5,117,059 | $(2,466,723) | 16.85 | 816 | NYSE AMS | Citadel | 0.80% |
| VNMC | 09/17/2020 | Natixis Vaughan Nelson Mid Cap ETF | $8,992,836 | $(144,031) | 14.79 | 1,393 | NYSE AMS | Citadel | 0.85% |
| ESGA | 07/15/2020 | American Century Sustainable Equity ETF | $145,275,120 | $14,700,612 | 14.91 | 9,522 | NYSE AMS | Citadel | 0.39% |
| MID | 07/15/2020 | American Century Mid Cap Growth Impact ETF | $21,295,238 | $12,246,412 | 14.93 | 2,483 | NYSE AMS | Citadel | 0.45% |
| ESGY | 07/01/2021 | American Century Sustainable Growth ETF | $5,721,282 | $431,686 | 8.55 | 2,179 | NYSE AMS | Citadel | 0.39% |
| NDVG | 08/05/2021 | Nuveen Dividend Growth ETF | $5,708,163 | $76 $768,444 | 7.79 | 6,291 | NYSE AMS | Citadel | 0.64% |
| NSCS | 08/05/2021 | Nuveen Small Cap Select ETF | $5,767,411 | $761,040 | 10.11 | 6,150 | NYSE AMS | Citadel | 0.85% |
| NWLG | 08/05/2021 | Nuveen Winslow Large-Cap Growth ESG ETF | $5,611,103 | $775,536 | 7.82 | 5,871 | NYSE AMS | Citadel | 0.64% |
| NUGO | 09/28/2021 | Nuveen Growth Opportunities ETF | $4,833,700 | $- | 7.91 | 63,508 | NYSE AMS | Citadel | 0.55% |
| FDG | 04/02/2020 | American Century Focused Dynamic Growth ETF | $207,475,808 | $(33,544,733) | 13.46 | 27,743 | ActiveShares | Citadel | 0.45% |
| FLV | 04/02/2020 | American Century Focused Large Cap Value ETF | $255,120,750 | $65,975,312 2 | 14.26 | 8,739 | ActiveShares | Citadel | 0.42% |
| CFCV | 05/28/2020 | ClearBridge Focus Value ETF | $4,001,879 | $352,439 | 26.19 | 515 | ActiveShares | GTS | 0.50% |
| FBCG | 06/04/2020 | Fidelity Blue Chip Growth ETF | $449,756,505 | $217,843,570 | 19.72 | 159,319 | Fidelity Proxy | GTS | 0.59% |
| FBCV | 06/04/2020 | Fidelity Blue Chip Value ETF | $95,387,288 | $42,862,100 | 25.67 | 43,199 | Fidelity Proxy | GTS | 0.59% |
| FMIL | 06/04/2020 | Fidelity New Millennium ETF | $58,014,200 | $29,791,148 | 20.62 | 27,278 | Fidelity Proxy | GTS | 0.59% |
| FGRO | 02/04/2021 | Fidelity Growth Opportunities ETF | $46,861,425 | $44,292,780 | 4.78 | 41,606 | Fidelity Proxy | Citadel | 0.59% |
| FMAG | 02/04/2021 | Fidelity Magellan ETF | $40,529,995 | $35,474,465 | 11.05 | 31,558 | Fidelity Proxy | RBC | 0.59% |
| FPRO | 02/04/2021 | Fidelity Real Estate Investment ETF | $18,039,000 | $14,621,700 | 4.21 | 13,116 | Fidelity Proxy | Citadel | 0.59% |
| FSMO | 02/04/2021 | Fidelity Small/Mid-Cap Opportunities ETF | $25,686,100 | $21,901,778 | 14.45 | 18,604 | Fidelity Proxy | RBC | 0.59% |
| FSST | 06/17/2021 | Fidelity Sustainability U.S. Equity ETF | $5,189,500 | $3,138,868 | 9.9 | 5,606 | Fidelity Proxy | RBC | 0.59% |
| FDWM | 06/17/2021 | Fidelity Women's Leadership ETF | $2,509,663 | $514,388 | 11.33 | 1,529 | Fidelity Proxy | RBC | 0.59% |
| TCHP | 08/05/2020 | T. Rowe Price Blue Chip Growth ETF | $218,308,490 | $138,913,083 | 8.97 | 47,453 | T Rowe Proxy | Virtu | 0.57% |
| TDVG | 08/05/2020 | T. Rowe Price Dividend Growth ETF | $99,566,357 | $56,402,161 | 7.53 | 16,311 | T Rowe Proxy | RBC | 0.50% |
| TEQI | 08/05/2020 | T. Rowe Price Equity Income ETF | $49,314,804 | $21,285,434 | 10.64 | 8,736 | T Rowe Proxy | Virtu | 0.54% |
| TGRW | 08/05/2020 | T. Rowe Price Growth Stock ETF | $43,045,007 | $13,185,478 | 8.1 | 6,218 | T Rowe Proxy | RBC | 0.52% |
| TSPA | 06/08/2021 | T. Rowe Price U.S. Equity Research ETF | $19,426,471 | $4,168,683 | 8.82 | 2,983 | T Rowe Proxy | RBC | 0.52% |
| IVDG | 12/22/2020 | Invesco Focused Discovery Growth ETF | $1,184,683 | $(150,680) | 14.62 | 1,279 | Invesco Model | Citadel | 0.59% |
| IVSG | 12/22/2020 | Invesco Select Growth ETF | $1,331,813 | $- | 14.47 | 908 | Invesco Model | Citadel | 0.48% |
| IVLC | 12/22/2020 | Invesco US Large Cap Core ESG ETF | $7,270,654 | $4,887,760 | 14.06 | 3,798 | Fidelity Proxy | Citadel | 0.48% |
| IVRA | 12/22/2020 | Invesco Real Assets ESG ETF | $1,847,054 | $433,080 | 51.75 | 2,300 | Fidelity Proxy | Citadel | 0.59% |
| LOPP | 02/01/2021 | Gabelli Love Our Planet & People ETF | $10,247,010 | $6,393,130 | 14.46 | 2,158 | ActiveShares | GTS | 0.90% |
| GGRW | 02/16/2021 | Gabelli Growth Innovators ETF | $3,814,500 | $1,158,250 | 25.51 | 603 | ActiveShares | GTS | 0.90% |
| FRTY | 03/01/2021 | Alger Mid Cap 40 ETF | $37,389,000 | $28,123,500 | 33.05 | 18,218 | ActiveShares | Virtu | 0.60% |
| ATFV | 05/04/2021 | Alger 35 ETF | $14,637,000 | $13,627,625 | 33.69 | 8,507 | ActiveShares | Virtu | 0.55% |
| REIT | 02/26/2021 | ALPS Active REIT ETF | $22,713,207 | $20,708,650 | 19.36 | 8,459 | Blue Tractor | GTS | 0.68% |
| STNC | 03/16/2021 | Stance Equity ESG Large Cap Core ETF | $36,067,932 | $6,272,674 | 27.56 | 2,763 | Blue Tractor | GTS | 0.85% |
| PFUT | 05/26/2021 | Putnam Sustainable Future ETF | $8,700,435 | $1,388,114 | 31.22 | 3,497 | Fidelity Proxy | Virtu | 0.64% |
| PLDR | 05/26/2021 | Putnam Sustainable Leaders ETF | $7,210,891 | $679,200 | 9.37 | 3,291 | Fidelity Proxy | RBC | 0.59% |
| PGRO | 05/26/2021 | Putnam Focused Large Cap Growth ETF | $9,511,843 | $700,098 | 8.79 | 6,798 | Fidelity Proxy | RBC | 0.55% |
| PVAL | 05/26/2021 | Putnam Focused Large Cap Value ETF | $9,670,000 | $- | 27.51 | 4,736 | Fidelity Proxy | Virtu | 0.55% |
Total/Average | $2,028,305,542 | $784,242,277 | 16.23 | 626,781 | 0.60% |
Source: Factset & NYSE Internal Database and Consolidated Tape Statistics as of 9/24/2021
*Simple average
September Active ETF Launches
Ticker | Name | Issuer | Launch Date | Asset Class | AUM |
|---|---|---|---|---|---|
| MINO | PIMCO Municipal Income Opportunities Active ETF | PIMCO | 09/09/2021 | Fixed Income | $41,672,400 |
| SXUS | Janus Henderson International Sustainable Equity ETF | Janus Henderson | 09/09/2021 | Equity | $46,560,023 |
| JZRO | Janus Henderson Net Zero Transition Resources ETF | Janus Henderson | 09/09/2021 | Equity | $47,660,024 |
| SCRD | Janus Henderson Sustainable Corporate Bond ETF | Janus Henderson | 09/09/2021 | Fixed Income | $49,520,050 |
| JIB | Janus Henderson Sustainable & Impact Core Bond ETF | Janus Henderson | 09/09/2021 | Fixed Income | $49,600,050 |
| HOM | LifeGoal Homeowner Investment ETF | LifeGoal | 09/09/2021 | Asset Allocation | $485,500 |
| WLTH | LifeGoal Wealth Builder ETF | LifeGoal | 09/09/2021 | Asset Allocation | $964,000 |
| SMI | VanEck HIP Sustainable Muni ETF | VanEck | 09/10/2021 | Fixed Income | $12,443,750 |
| DFAX | Dimensional World ex U.S. Core Equity 2 ETF | Dimensional Holdings | 09/13/2021 | Equity | $4,498,233,331 |
| DFIV | Dimensional International Value ETF | Dimensional Holdings | 09/13/2021 | Equity | $3,511,194,431 |
| USVT | US Value ETF | Lyrical | 09/14/2021 | Equity | $630,500 |
| CYA | Simplify Tail Risk Strategy ETF | Simplify Asset Management Inc. | 09/14/2021 | Asset Allocation | $12,384,575 |
| PSIL | AdvisorShares Psychedelics ETF | AdvisorShares | 09/16/2021 | Equity | $2,113,120 |
| EVNT | AltShares Event-Driven ETF | Water Island Capital Partners LP | 09/20/2021 | Alternatives | $3,522,210 |
| QSPT | FT Cboe Vest Nasdaq-100 Buffer ETF - September | First Trust | 09/20/2021 | Equity | $12,824,539 |
| YSEP | FT Cboe Vest International Equity Buffer ETF - September | First Trust | 09/20/2021 | Equity | $2,964,490 |
| DSCF | Alpha Architect ETF Trust - Discipline Fund ETF | EMPIRICAL FINANCE LLC | 09/21/2021 | Asset Allocation | $4,682,778 |
| BNDD | KraneShares Quadratic Deflation ETF | KraneShares | 09/21/2021 | Fixed Income | $5,388,103 |
| CRPT | First Trust SkyBridge Crypto Industry and Digital Economy ETF | First Trust | 09/21/2021 | Equity | $6,377,036 |
| SPC | CrossingBridge Pre-Merger SPAC ETF | Cohanzick Management | 09/21/2021 | Equity | $5,811,600 |
| HSUN | Hartford Sustainable Income ETF | The Hartford | 09/22/2021 | Fixed Income | $49,514,290 |
| BUDX | Cannabis Growth ETF | Banhazl | 09/27/2021 | Equity | $3,986,980 |
| NUGO | Nuveen Growth Opportunities ETF | TIAA | 09/27/2021 | Equity | $4,833,700 |
| OBND | SPDR Loomis Sayles Opportunistic Bond ETF | State Street | 09/28/2021 | Fixed Income | $30,017,568 |
| TYA | Simplify Risk Parity Treasury ETF | Simplify Asset Management Inc. | 09/28/2021 | Fixed Income | $2,513,610 |
| SSFI | Day Hagan/Ned Davis Research Smart Sector Fixed Income ETF | Donald L. Hagan LLC | 09/29/2021 | Fixed Income | $3,730,500 |
| TBUX | T. Rowe Price Ultra Short-Term Bond ETF | T. Rowe Price Group, Inc. | 09/29/2021 | Fixed Income | $20,004,000 |
| TOTR | T. Rowe Price Total Return ETF | T. Rowe Price Group, Inc. | 09/29/2021 | Fixed Income | $20,035,960 |
| AVES | Avantis Emerging Markets Value ETF | American Century Investments | 09/30/2021 | Equity | $4,020,000 |
| AVRE | Avantis Real Estate ETF | American Century Investments | 09/30/2021 | Equity | $1,986,300 |
| AVIV | Avantis International Large Cap Value ETF | American Century Investments | 09/30/2021 | Equity | $1,498,629 |
Total - 31 New ETFs | $8,457,174,045 |
Source: Factset as of 9/24/2021
NYSE ETF Summit & Active ETF Issuer Insights
Missed the April NYSE ETF Summit or our Active ETF Webinar series? Access replays from the Summit here or visit HomeofETFs.com to catch up.
Hear from ETF experts representing the various active ETF structures, fund sponsors such as American Century, Fidelity, PIMCO and T. Rowe Price, liquidity providers such as Flow Traders and Jane Street, and service providers such as BNY Mellon and State Street.