2020 is Becoming the "Year of Active"
October 15, 2020
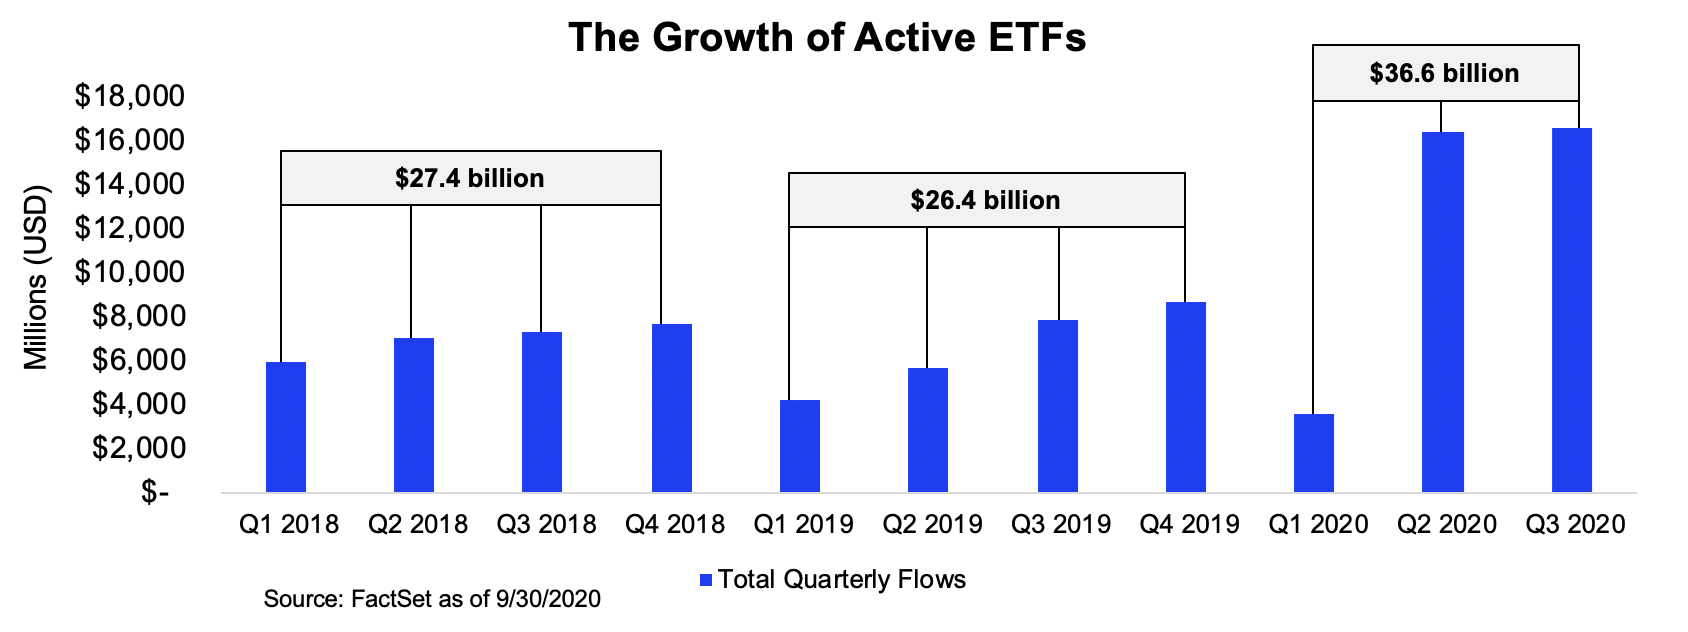
At the New York Stock Exchange, 2020 is becoming the “Year of Active” for ETFs. Over the past year, industry assets have increased by 150%, now totaling $139 billion. Year-to-date cash flow is $36.6 billion, already shattering the 2018 full-year record of $27.4 billion. 110 active ETFs have launched so far, more than any other year on record. Need more? The industry welcomed 19 new ETF firms in the first three quarters of the year, including novel products from mutual fund giants Fidelity and T. Rowe. Now the question is becoming: is this the new normal for the ETF industry?
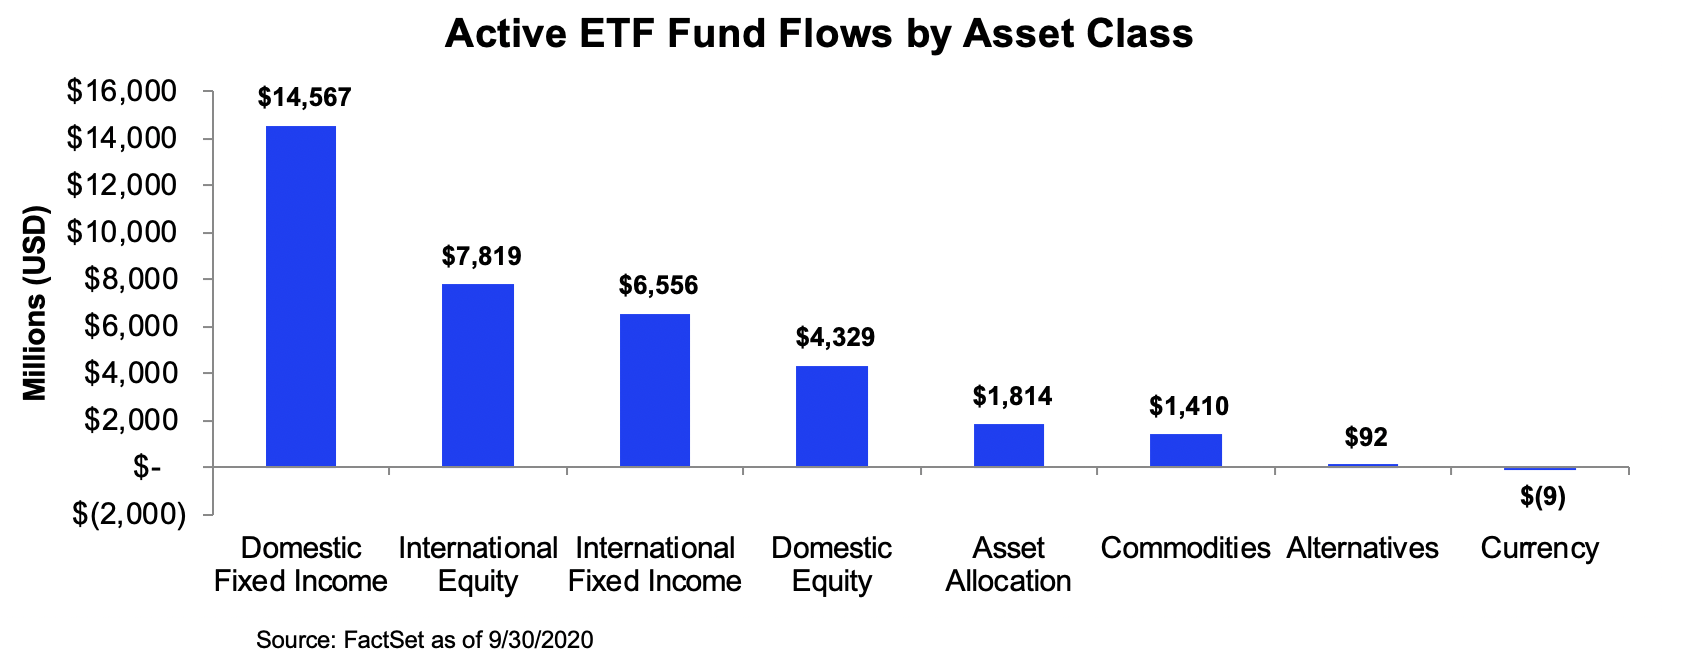
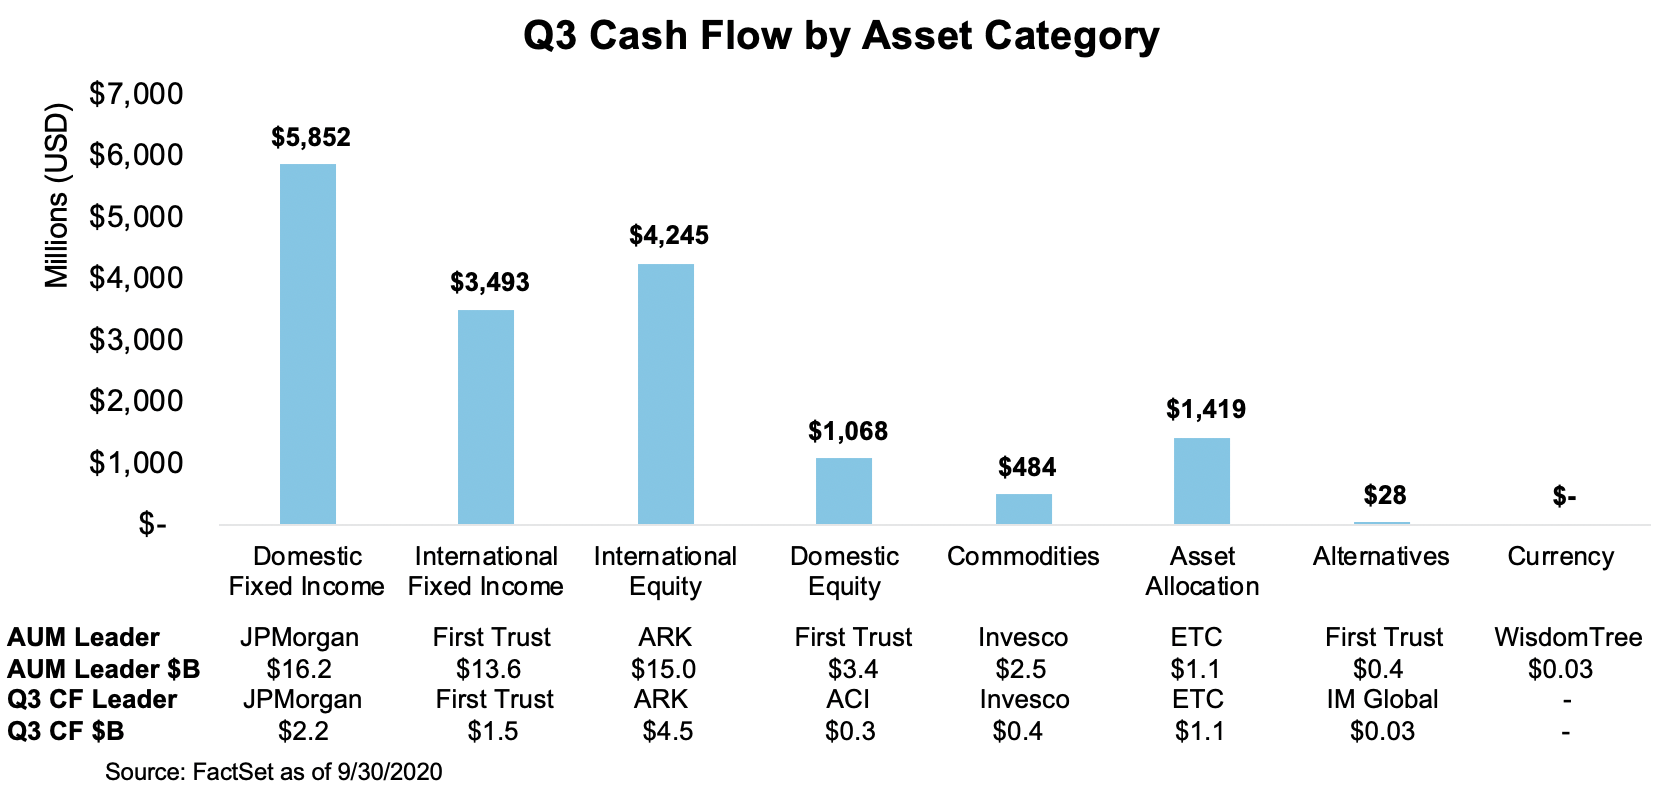
IThere has been growth across nearly all asset classes so far this year. In addition, three-fourths of these asset classes set new cash flow records through the first three quarters. Ultra and short-term ETFs, as well as intermediate term “Core” ETFs, continue to lead Fixed Income flows. Thematic ETFs (Innovation, Robotics, etc.) and large-cap, U.S.-focused defined outcome ETFs lead Equity flows.
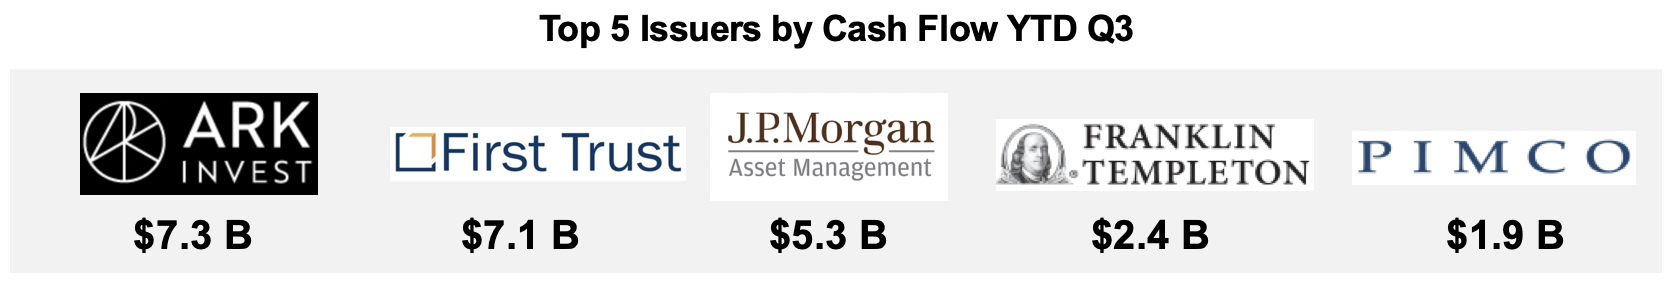
At the issuer level, thematic equity-focused ARK Funds unseated First Trust to lead the industry in flows for the first time, with $7.3 billion. Collectively, the top five issuers accounted for 65% of cash flow - down from 68% in the first half and continuing a trend of declining flow concentration. Translation: competition is heating up and, unlike the broader industry, it’s not winner take all. Just outside of the top five, Janus Henderson ($1.7 billion), Exchange Traded Concepts ($1.4 billion), CICC/Quadratic ($0.5 billion), PGIM ($0.3 billion) and VictoryShares ($0.2 billion) experienced the highest quarter-over-quarter growth. In total, ~90% of issuers saw positive cash flow during the first three quarters of 2020, with a median cash flow of $32 million and an average cash flow of $451 million.
IThere has been growth across nearly all asset classes so far this year. In addition, three-fourths of these asset classes set new cash flow records through the first three quarters. Ultra and short-term ETFs, as well as intermediate term “Core” ETFs, continue to lead Fixed Income flows. Thematic ETFs (Innovation, Robotics, etc.) and large-cap, U.S.-focused defined outcome ETFs lead Equity flows.
Top 10 ETFs by Cash Flow ($M) | ||
ARKK |
ARK Innovation |
4.26 |
JPST |
JP Morgan Ultra-Short Income |
4.24 |
FIXD |
First Trust TCW Opportunistic FI |
2.59 |
LMBS |
First Trust Low Duration Opportunities |
2.23 |
ICSH |
iShares Ultra-Short Bond |
2.12 |
VNLA |
Janus Henderson Short Duration Income |
1.36 |
ARKW |
ARK Next Gen Internet |
1.19 |
PDBC |
Invesco Optimum Yld Divers. Commodity |
1.17 |
ARKG |
ARK Genomic Revolution |
1.08 |
BOND |
PIMCO Active Bond |
0.69 |
|
Top 10 Total Cash Flow |
20.93 |
Bottom 10 ETFs by Cash Flow ($M) | ||
|---|---|---|
NEAR |
iShares Short Maturity |
(1.04) |
SRLN |
SPDR Blackstone/GSO Senior Loan |
(0.90) |
GDVD |
Principal Active Global Dividend Income |
(0.47) |
EMLP |
First Trust NA Energy Infrastructure |
(0.40) |
FTSL |
First Trust Senior Loan |
(0.28) |
TOTL |
SPDR DoubleLine Total Return Tactical |
(0.14) |
POCT |
Innovator S&P 500 Power Buffer-Oct. |
(0.13) |
LRGE |
ClearBridge Large Cap Growth ESG |
(0.11) |
BOCT |
Innovator S&P 500 Buffer-Oct. |
(0.11) |
RFDI |
First Trust Riverfront Dynamic Developed Int'l |
(0.09) |
|
Bottom 10 Total Cash Flow |
(3.66) |
Source: Factset as of September 30, 2020
Spotlight on Q3 2020
The maturation of the market outside of Fixed Income is one of the primary reasons why 2020 has been a record-breaking year. During the third quarter, nearly one out of two new dollars went to a non-Fixed Income strategy, up from the three-year average of one out of four.
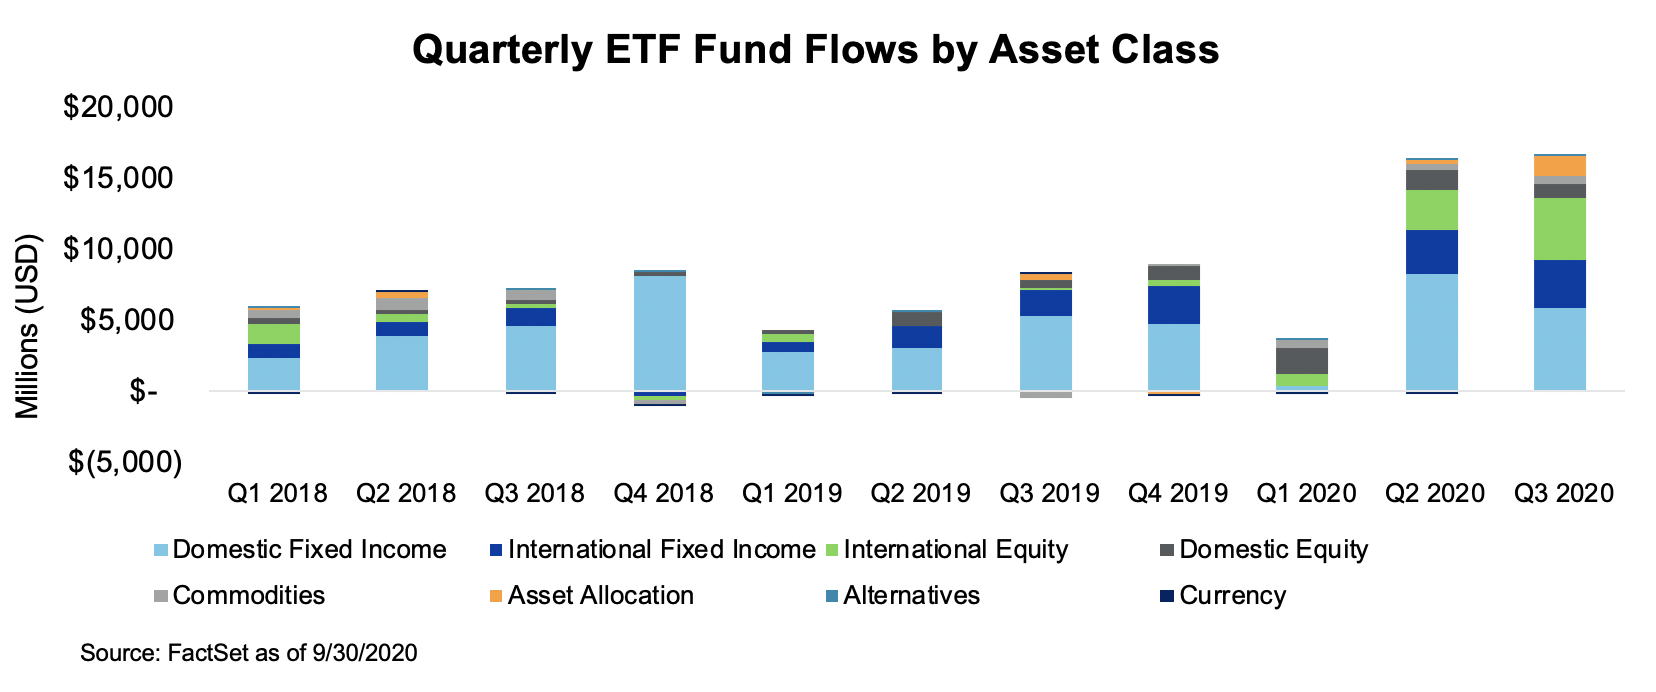
At the issuer level, market leaders JP Morgan ($2.3 billion) and First Trust ($2.2 billion) drove Fixed Income growth during the quarter. Other notable contributions came from PIMCO ($1.0 billion) and Janus Henderson ($0.75 billion). ARK Funds ($4.5 billion) and American Century ($0.4 billion) continued to lead Equity growth. Outside of the top three Equity firms, JP Morgan ($83 million), new entrant Fidelity ($83 million), Amplify ($74 million), Nationwide ($71 million) and TrimTabs ($66 million) collectively gathered $0.4 billion across a balance of growth and income strategies. Among the remainder of asset classes, the most notable growth occurred within Asset Allocation strategies. Exchange Traded Concepts partner Cabana launched a series of five ETFs that accumulated over $1 billion in flows over the quarter.
Active ETF Stat Pack
| Firms | |||
| # of Issuers | 82 | ||
| # of New Issuers 2020 | 19 | ||
| Products | Assets | ||
| # of ETFs | 422 | AUM ($B) | $142.37 |
| # of New Launches 2020 | 110 | 3 Yr AUM CAGR | 153% |
| Avg. ER | 0.50% | 5 Yr AUM CAGR | 49% |
| Cash Flow | Trading | ||
| YTD Cash Flow ($B) | $38.1 | YTD ADV (Shares) | 37,172,98 |
| 3 Yr Cash Flow | $96 | YTD ADV ($) | $1.49 B |
| 5 Yr Cash Flow | $115.2 | YTD Avg. Spread (bps)* | 41.65 |
Active Semi-Transparent ETFs
Source: Factset & NYSE Internal Database and Consolidated Tape Statistics as of 10/9/2020
*Simple average
NYSE ETF Summit & Active ETF Webinar Series Replay
Missed the NYSE ETF Summit or our Active ETF Webinar series?
Visit HomeofETFs.com to catch-up
You'll find opportunities to hear from:
- ETF experts from each of the various active ETF structure providers
- Fund sponsors, such as American Century, Fidelity, PIMCO and T. Rowe Price
- Liquidity providers, such as Flow Traders and Jane Street
- Service providers, such as BNY Mellon and State Street