» An update on semi-transparent ETFs
» Exploring the NYSE AMS to build low overlap proxy portfolios
July 30, 2020
The industry welcomed the third active, semi-transparent structure — and the first products using the New York Stock Exchange's methodology — with the launch of American Century's sustainability-focused ESGA and MID ETFs on July 15. Collectively, semi-transparent assets now exceed $375 million across eight products.
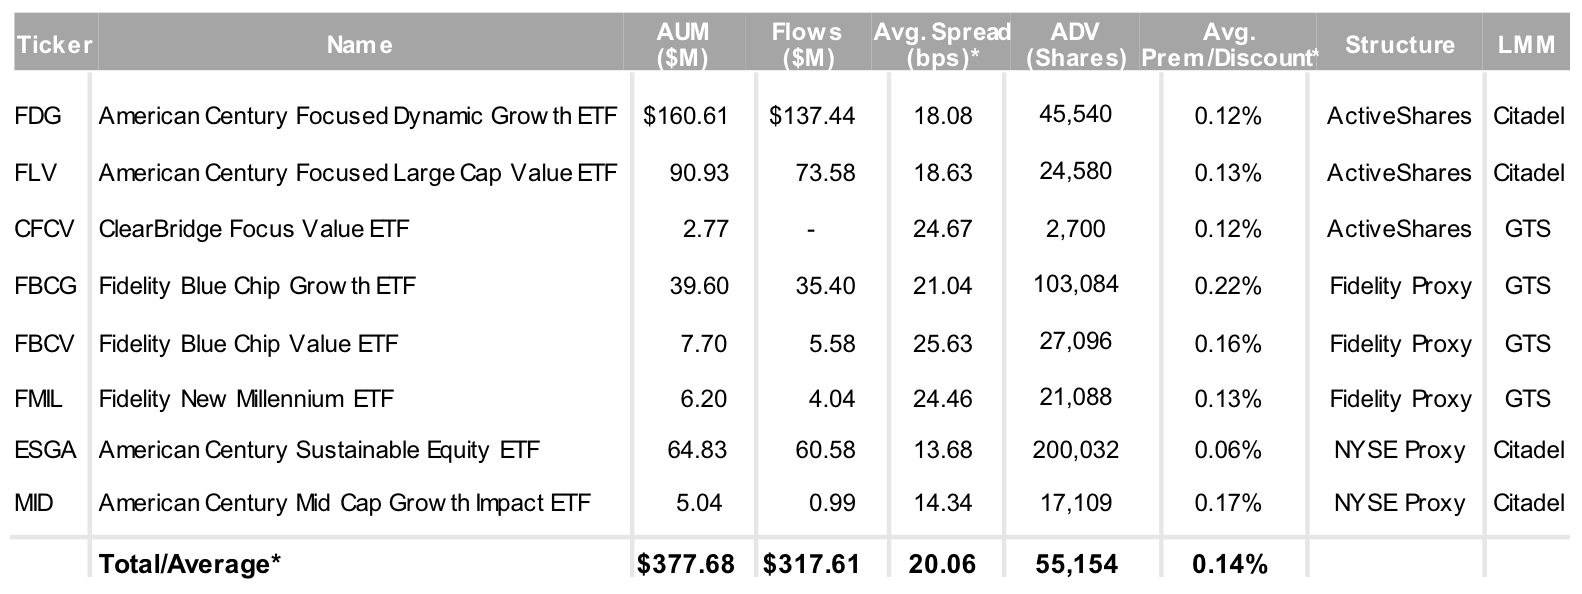
Source: Factset & NYSE Internal Database and Consolidated Tape Statistics as of 7/24/2020
*Simple average since ETF inception
Over the last month, assets have increased by ~$150 million driven by ~$90 million in new cash flow to the proxy structure ETFs from American Century (~$60 million) and Fidelity (~$30 million). Spreads have largely remained in an average range between 13-25 bps, which is below the active equity average of ~45 bps. Unsurprisingly, volumes have been chunky with most products experiencing a few outsized trading days. The exception is Fidelity's Blue-Chip Growth ETF (FBCG), which has experienced largely consistent volume day over day.
Daily Volume (Shares) by Active, Semi-Transparent ETF
(4/2-7/24/2020)
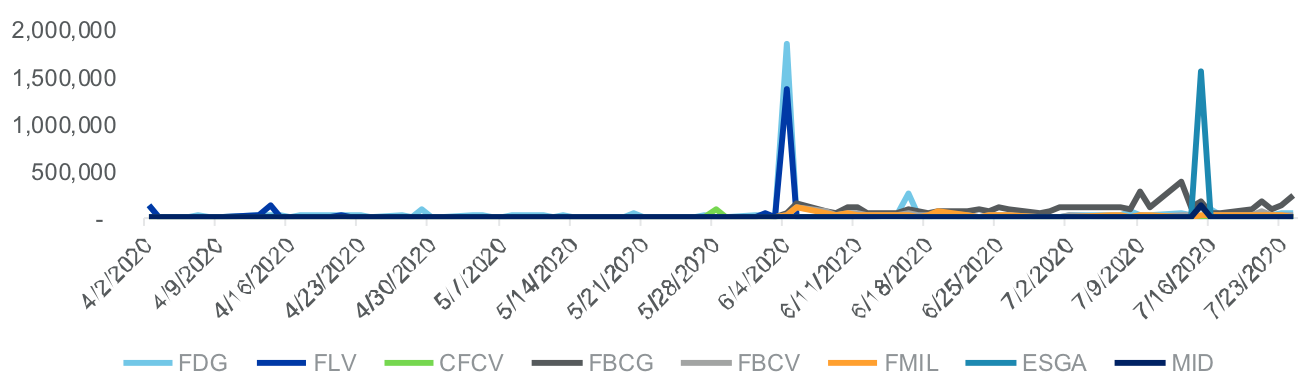
Source: Factset & NYSE Internal Database and Consolidated Tape Statistics as of 7/24/2020
In an upcoming issue, we will dive deeper into the trading of these products with a Q&A featuring Citadel Securities. Please email your questions to [email protected]. And MID ETOver
An analysis of the NYSE semi-transparent solution: building a proxy with a low overlap (50%)
In the second edition of the NYSE Active ETF Update, we examined using the NYSE Actively Managed Solution (AMS) to mask a moderate portion (~25%) of one's portfolio. This week, we explore a lower overlap strategy in which approximately half of the portfolio weight was hidden by the optimizer.
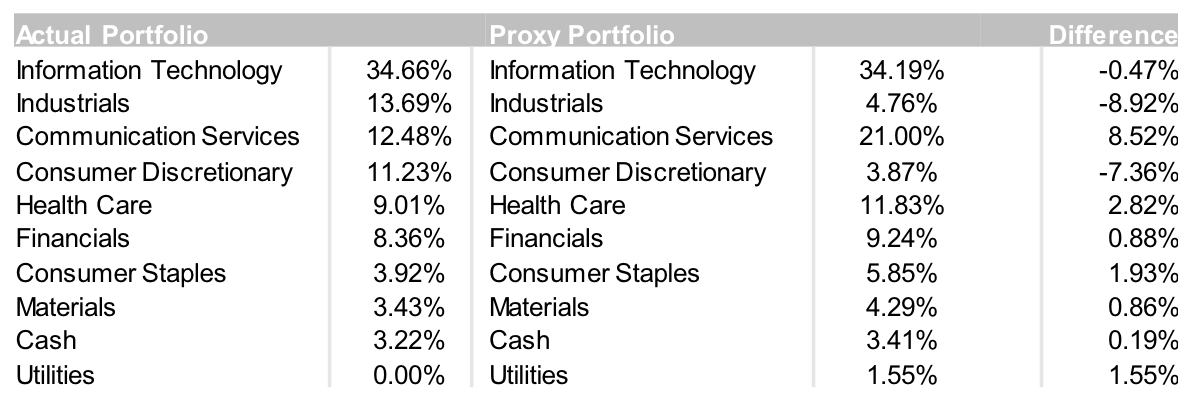
Example Summary
Objective: Mask ~50% of actual portfolio holdings and maintain a similar # of securities in proxy portfolio
Investment Strategy: Large Cap Growth, 50 securities in actual portfolio
Constraints: Restrict ~50% of holdings, limit proxy to 55 names selected from S&P 500 Growth Index
Names Restricted: MSFT, SBUX, EL, AMD, PYPL, ICE, NDAQ, OTIS, CARR, CME, AMZN, ISRG, ROL, VRSK, UNP, RTX, CRM, ADBE, TXN
Time Frame: 6/15 - 6/26/2020
Much like the moderate overlap portfolio, this low overlap portfolio presents an opportunity for an asset manager to either mask a large strategy repositioning, or to hide a substantial amount of alpha in the portfolio. While this example hides ~25% more of the actual portfolio than our prior example, there was only an additional four bps of daily tracking error for this new strategy, highlighting the efficiency of the Axioma optimizer and the AMS structure.
NYSE Actual vs. Proxy Tick by Tick Performance
(6/30/2020-7/10/2020)
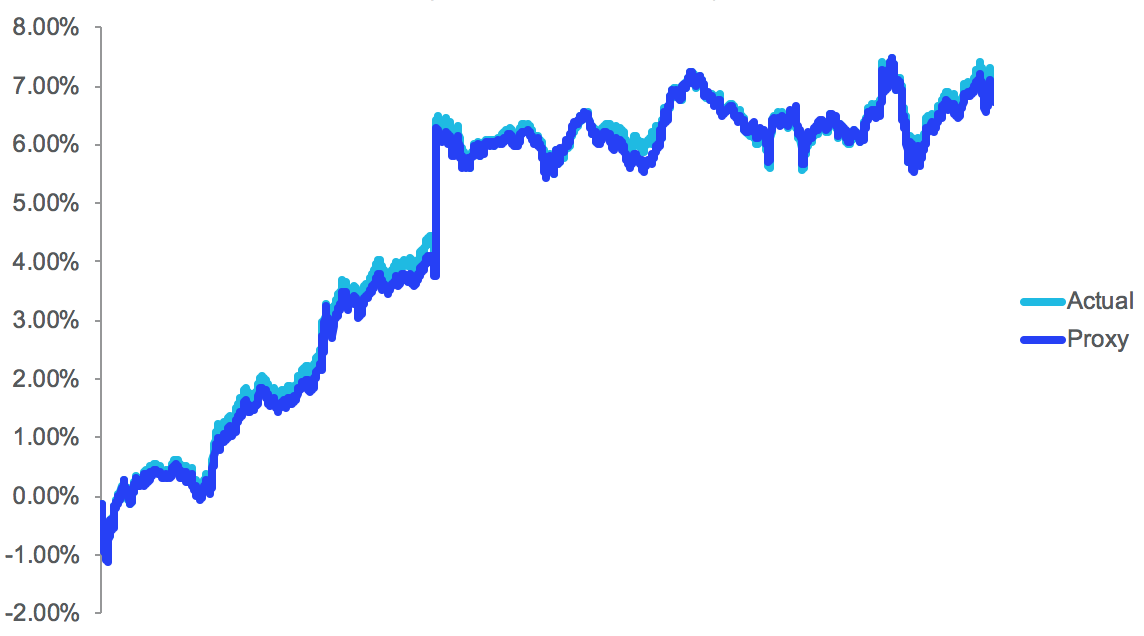
Average Daily Portfolio Overlap*: 42.61%
Average Expected Daily Tracking Error: 0.27%
Average Actual Daily Tracking Error: 0.10%
*Portfolio overlap is the common weight between the actual portfolio (actual holdings not disclosed to public) and proxy portfolio (created daily and disclosed to public as create/redeem basket).
Notably, the proxy, despite masking half of the portfolio weight, tracked the actual portfolio in lockstep with the greatest intraday variation at only 40 bps.
Daily Expected vs. Actual Tracking Error
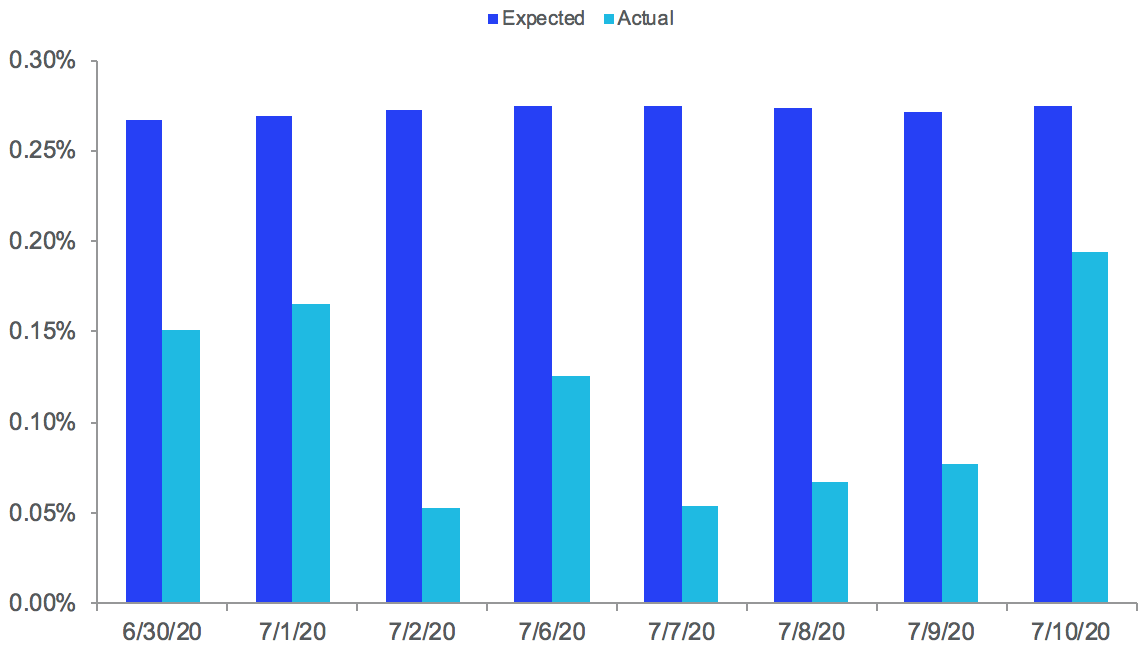
Daily Expected vs. Actual Tracking Error
If you would like additional details/data from this exercise or if you have a portfolio or strategy that you would like to see tested, please contact [email protected].
ETF Stat Pack
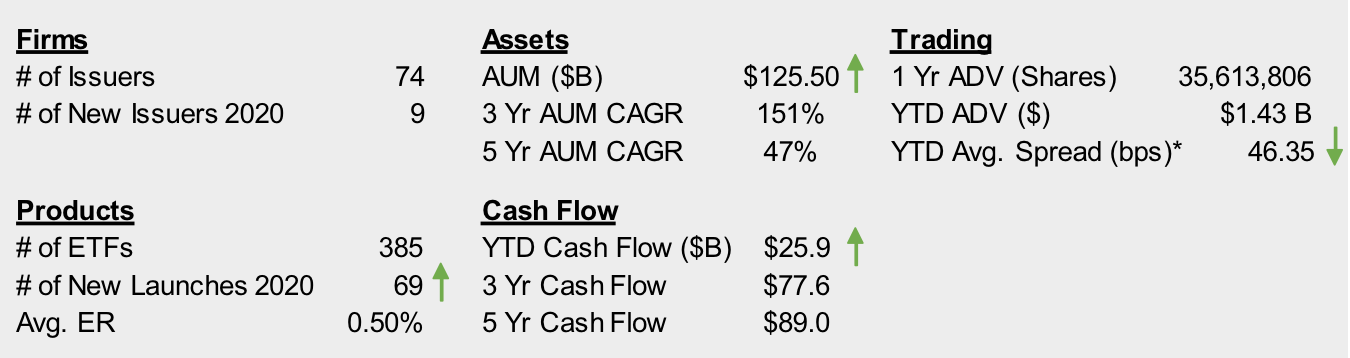
Source: Factset & NYSE Internal Database and Consolidated Tape Statistics as of 7/24/2020
*Simple Average