July 15, 2020
At the New York Stock Exchange, we proclaimed 2020 the “Year of Active” in ETFs and through the first half it’s hard to argue. The industry set a new high watermark for assets: $117.8 billion; half year cash flow: $20 billion; products launched: 56; and average daily volume: 34.5 million shares. Need more? Year-over-year cash flow more than doubled and the industry is well on its way to breaking the full year record of $27.4 billion set in 2018.
The Growth of Active ETFs
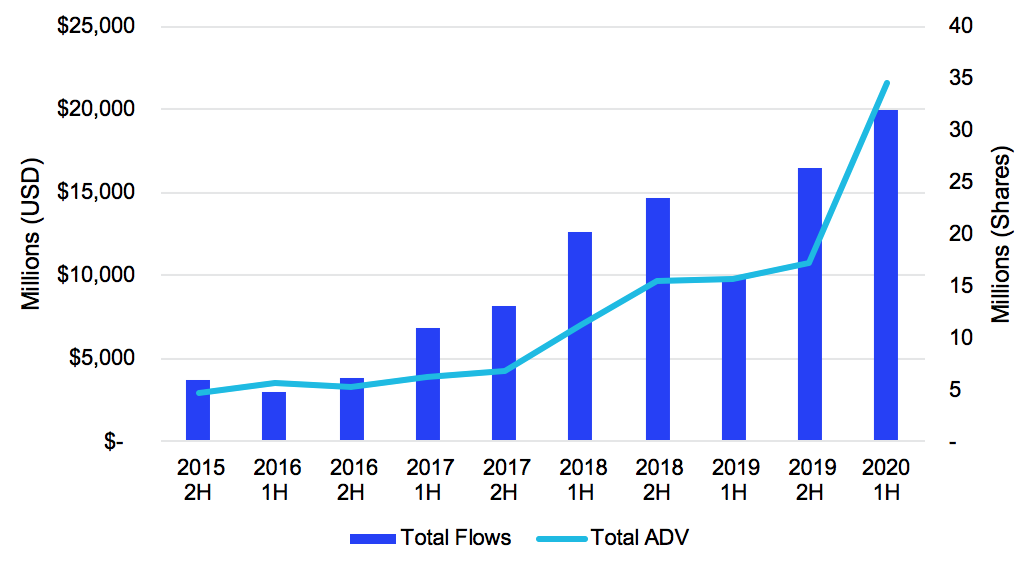
Source: Factset & NYSE Internal Database and Consolidated Tape Statistics as of 6/30/2020
The industry has seen growth across nearly all asset classes so far this year. One-third of these asset classes set new cash flow records in the first half. Fixed Income flows were led by ultra and short-term ETFs as well as intermediate term “Core” ETFs. Equity flows were led by large cap U.S.-focused defined outcome and thematic (Innovation, Robotics, etc.) ETFs.
The Growth of Active ETFs
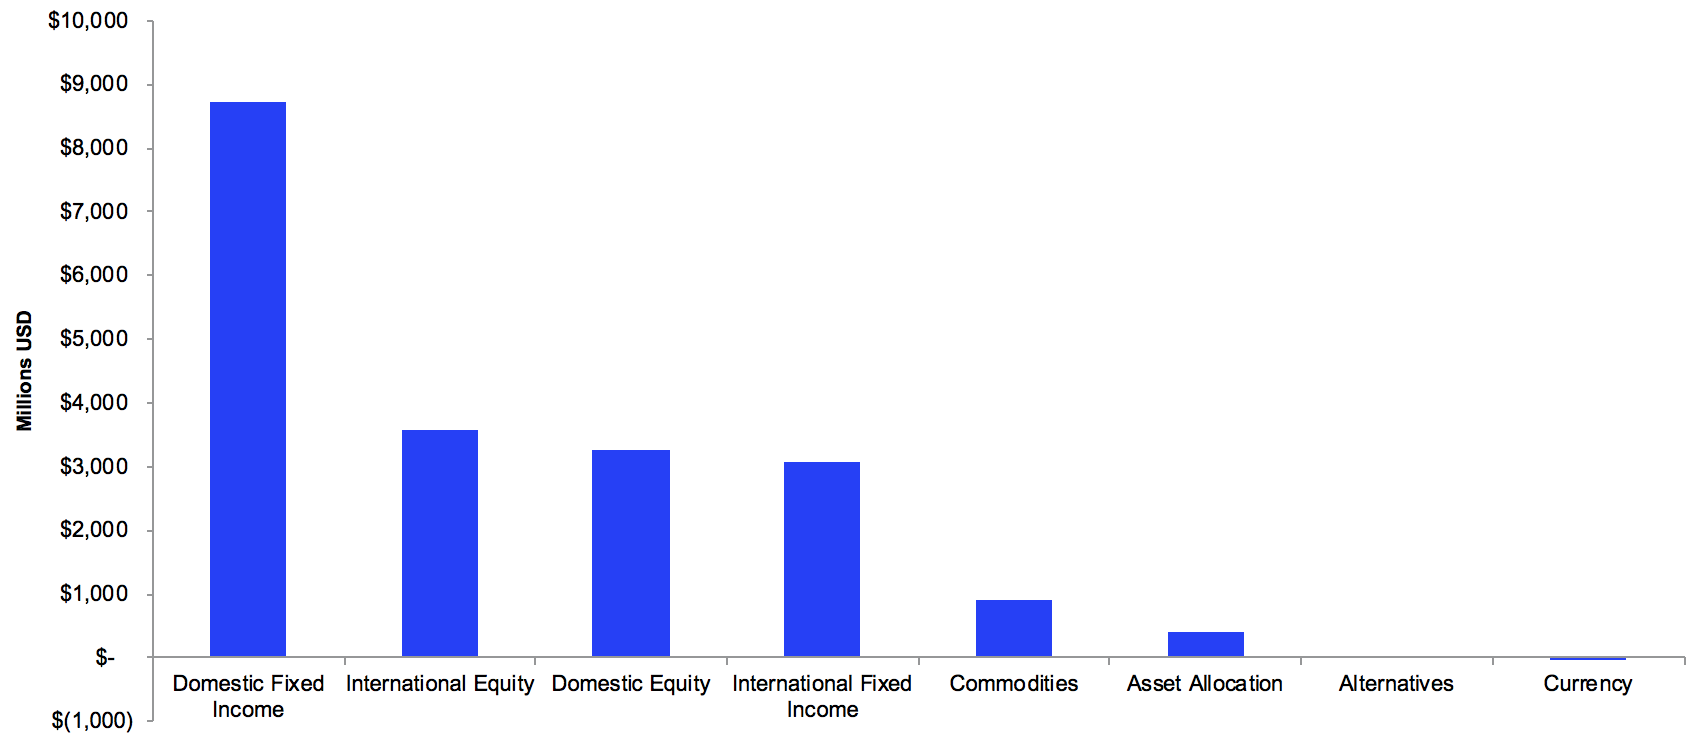
Source: Factset & NYSE Internal Database and Consolidated Tape Statistics as of 6/30/2020
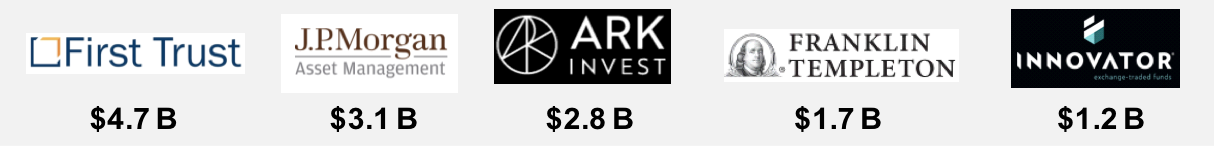
At the issuer level, First Trust led the industry in first half flows for the fourth straight year with $4.7 billion. Collectively, the top five issuers accounted for 68% of cash flow - a new first half low and over 10% less than their five-year average. Translation: competition is heating up and, unlike the broader industry, it’s not winner take all. Just outside of the top five, American Century ($1 billion), Janus Henderson ($0.95 billion), Fidelity ($0.43 billion), Exchange Traded Concepts ($0.34 billion), AdvisorShares ($0.23 billion), Anfield ($0.17 billion) and Aptus/Opus ($0.17 billion) all set new half-year records. In total, four out of every five issuers saw positive cash flow during the first half of 2020.
Top 5 Issuers by Cash Flow
Top 10 ETFs by Cash Flow ($M)
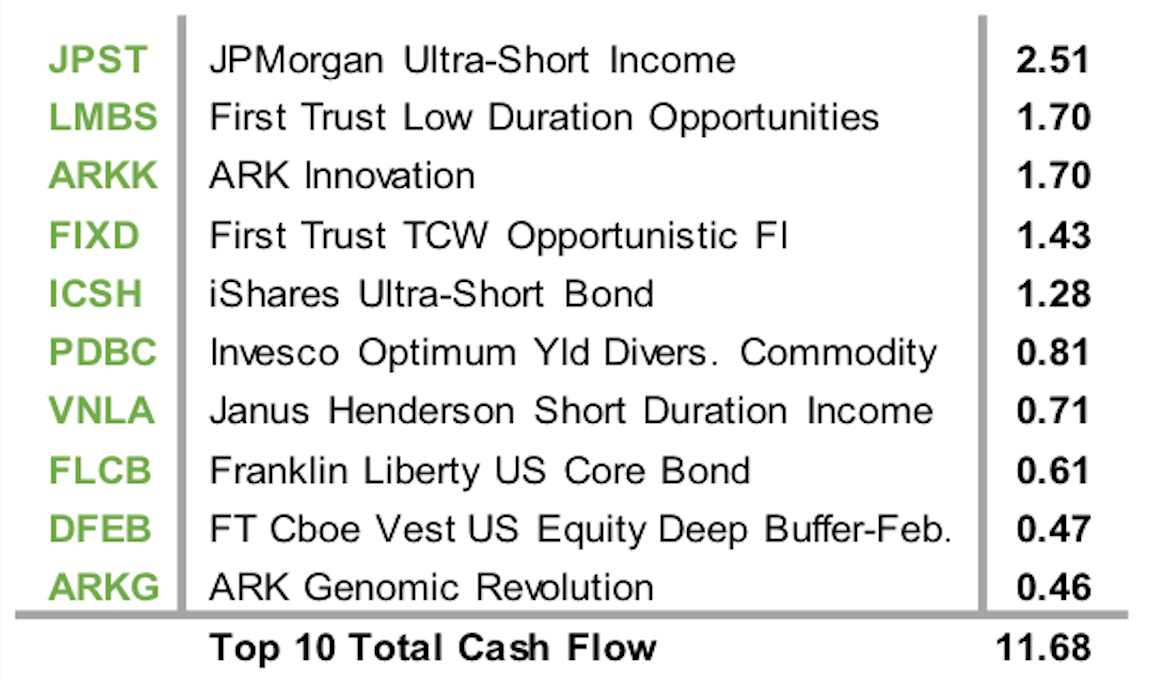
Source: Factset as of 6/30/2020
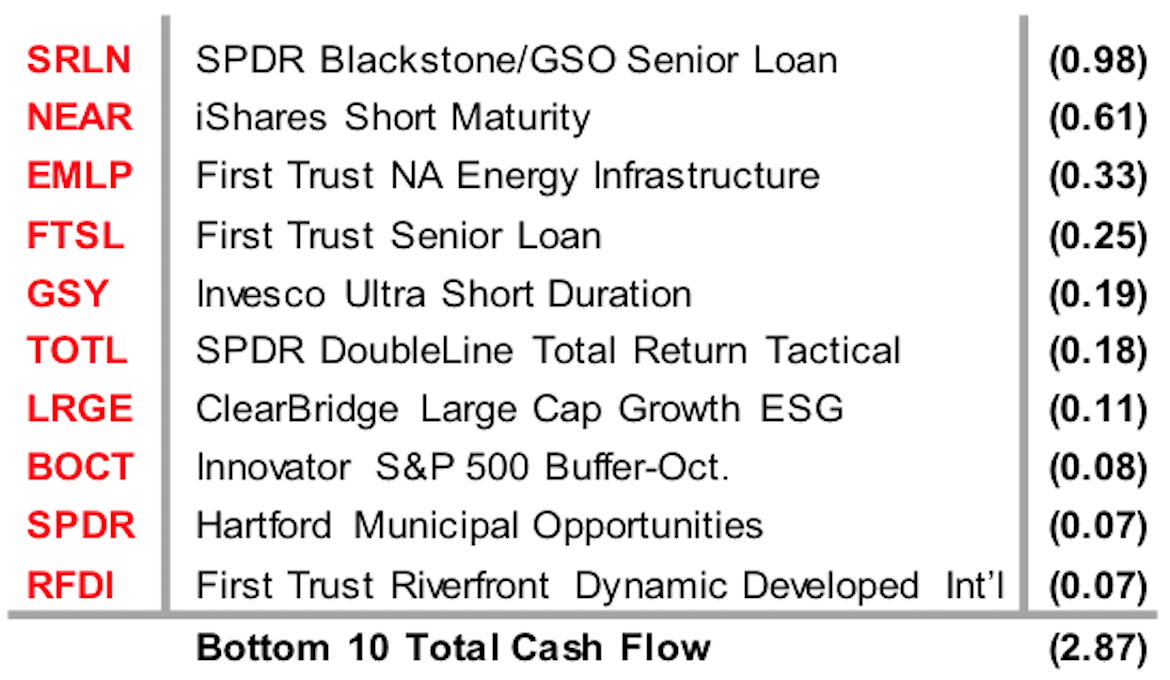
Bottom 10 ETFs by Cash Flow ($M)
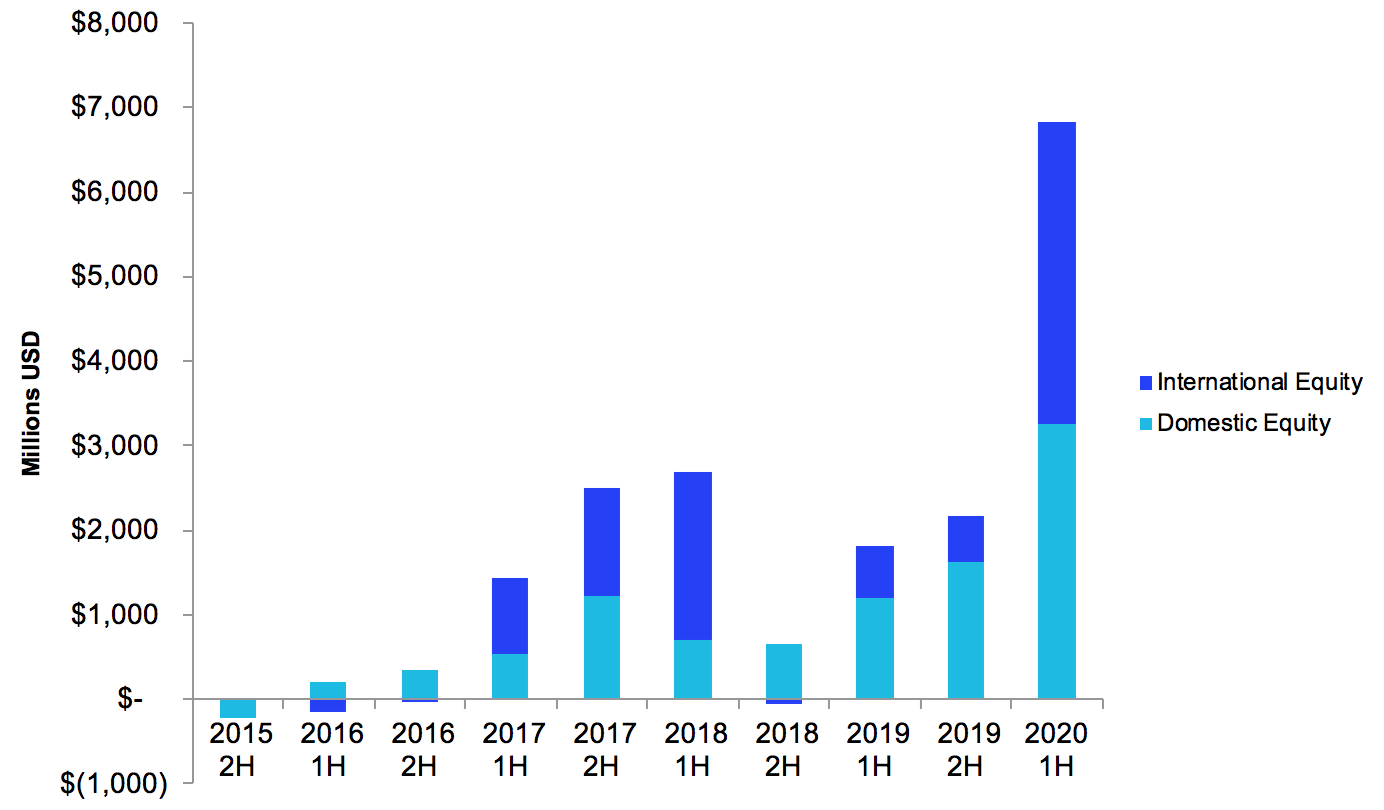
Spotlight on the rise of active equity
One of the primary reasons why the first half of 2020 has been record breaking is the rise of active equity strategies. As demonstrated below, 2020 marks both an absolute and asset-class-relative record for the asset class.
The Growth of Active ETFs
Source: Factset & NYSE Internal Database and Consolidated Tape Statistics as of 6/30/2020
Two firms — ARK and American Century — are leading this space, each in a unique way.
ARK has found a niche with a suite of five ETFs focused on disruptive innovation. They have seen first half flows greater than the prior five years combined. This is aided by its top quartile multi-year performance record.
The Growth of Active ETFs
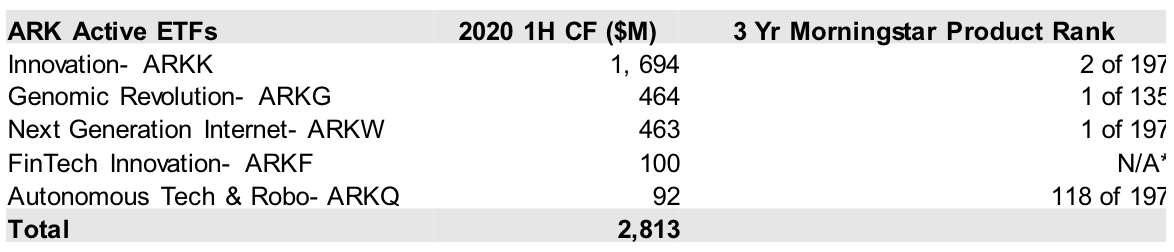
Source: Factset & Morningstar as of 6/30/20
*3 Year Product Rank unavailable
American Century has a long-standing track record as an active equity manager, but it didn’t enter the active ETF market until late in 2019 when it launched a suite of five more traditional ETFs under the Avantis name. Since launch, it has quickly accumulated $1.2 billion in cash flow, including $0.78 billion in the first half. Pair this with the recent addition of the industry’s first two semi-transparent ETFs and American Century gathered nearly $1 billion in first half flows.
The Growth of Active ETFs
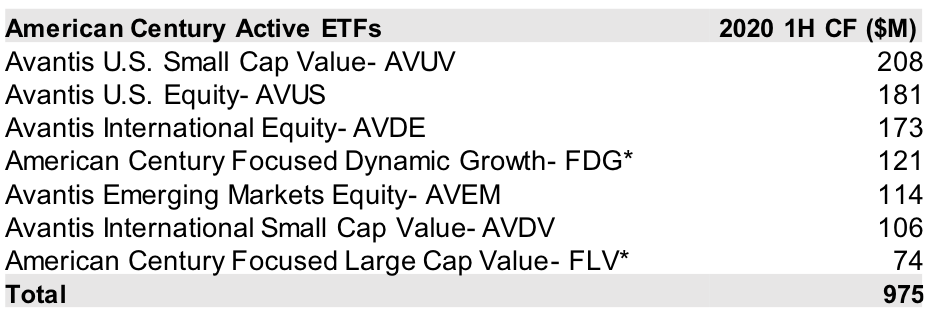
Source: Factset as of 6/30/20
*Semi-transparent ETFs
ETF Stat Pack
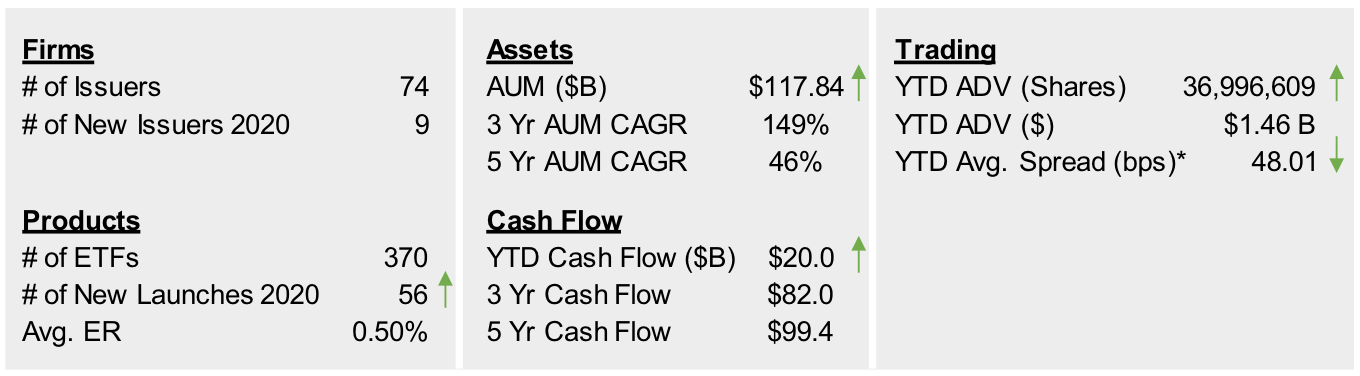
Source: Factset & NYSE Internal Database and Consolidated Tape Statistics as of 6/30/2020
*Simple Average