» Checking in on the newest active ETFs
» Exploring the NYSE AMS to build moderate overlap proxy portfolios
July 1, 2020
Nearly three months have passed since American Century launched the first suite of semi-transparent ETFs under the Precidian ActiveShares structure. It has since been joined by Legg Mason/Clearbridge (ActiveShares) and Fidelity (self-developed), bringing the total to six ETFs across two distinct structures. So how have they fared?
The Growth of Active ETFs
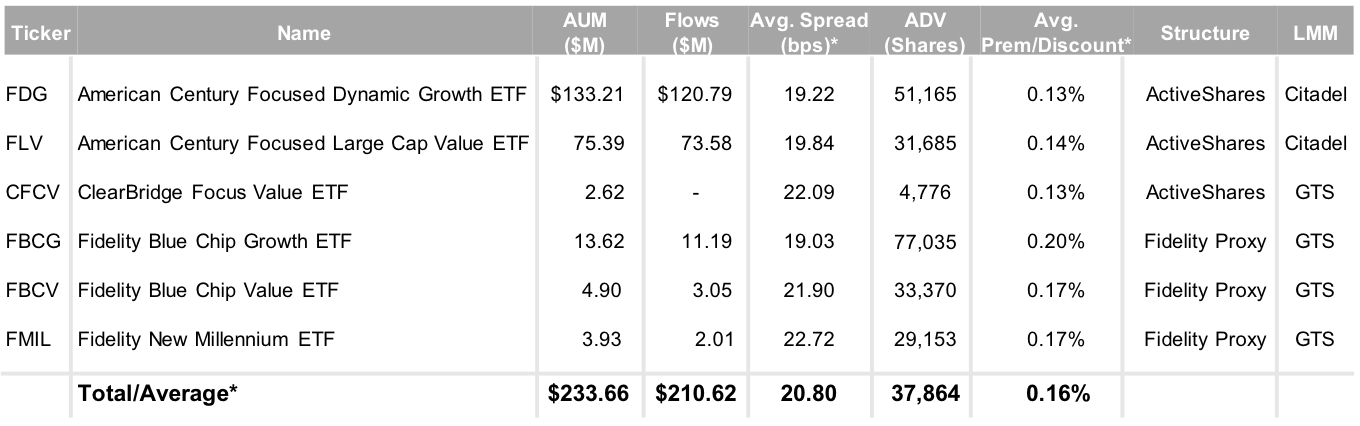
Source: Factset & NYSE Internal Database and Consolidated Tape Statistics as of 6/26/2020
*Simple average since ETF inception
With an additional seven ETFs receiving 19b-4 approval this week from Natixis (1-NYSE), American Century (2-NYSE) and T. Rowe Price (4-self-developed) and 15 in filing across Nottingham, Fred Alger, Gabelli, JPMorgan and BlackRock, there will be plenty to analyze in the second half of the year.
An analysis of the NYSE semi-transparent solution: building a proxy with a moderate portfolio overlap
Over the coming months, we will share strategies that can be used to build a proxy portfolio using the NYSE Actively Managed Solution (AMS).
Each example will include a summary of the design, an analysis of the expected and actual tracking error and related statistics using output from Axioma and NYSE Connect.
Example Summary
Objective: Mask ~25% of actual portfolio holdings and maintain a similar # of securities in proxy portfolio
Investment Strategy: Large Cap Growth, 50 securities in actual portfolio
Constraints: Restrict ~25% of holdings, limit proxy to 55 names selected from Russell 1000 Growth Index
Names Restricted: MSFT, SBUX, EL, AMD, PYPL, ICE, NDAQ, CME, OTIS, CARR
Time Frame: 6/15 - 6/26/2020
A strategy like this could be used daily by an asset manager who is sensitive to holdings disclosure or when executing a large-strategy repositioning. When considering a lower overlap strategy, an asset manager should analyze the trade-offs gained from selective disclosure vs. loss of in-kind tax efficiency and the potential for a wider bid/ask spread.
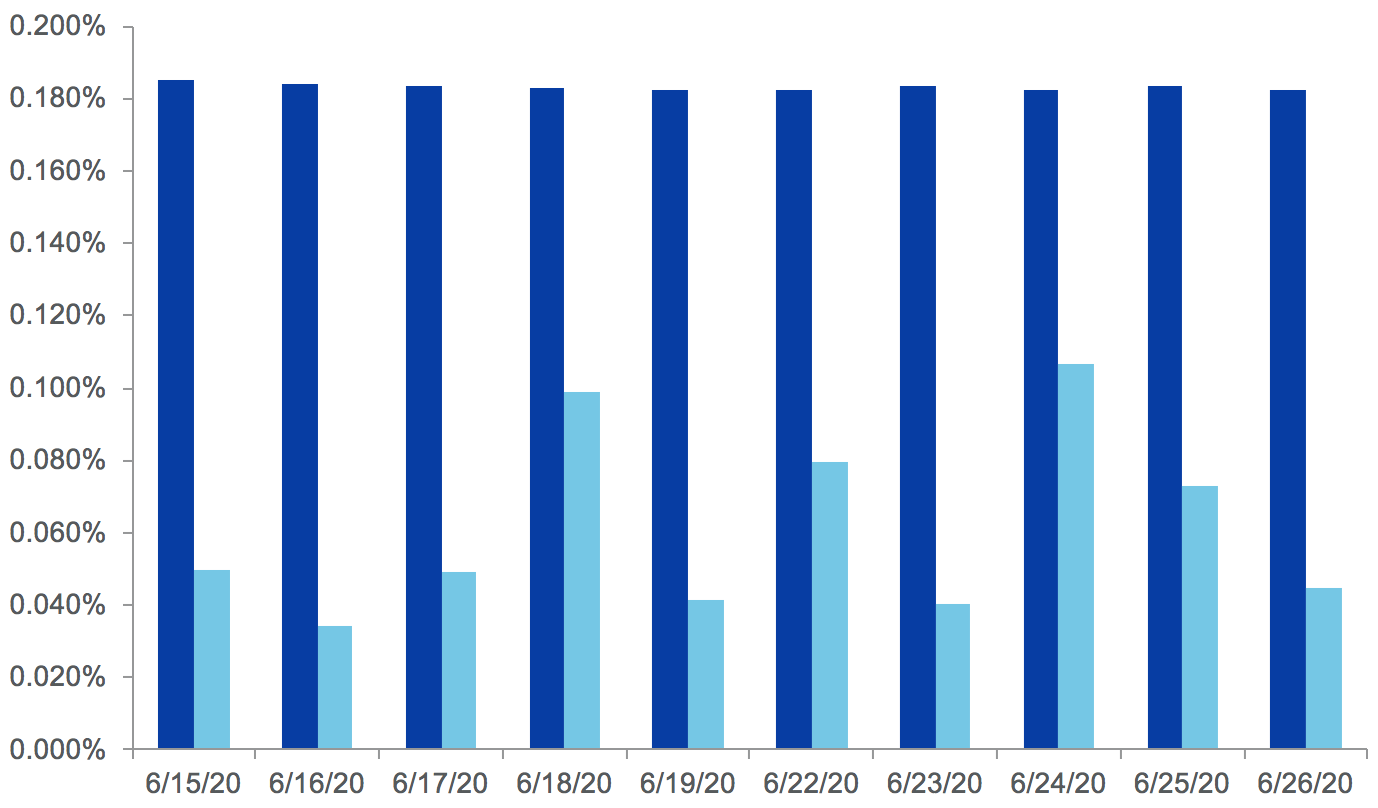
NYSE Actual vs. Proxy Tick by Tick Performance
(6/15/2020-6/26/2020)
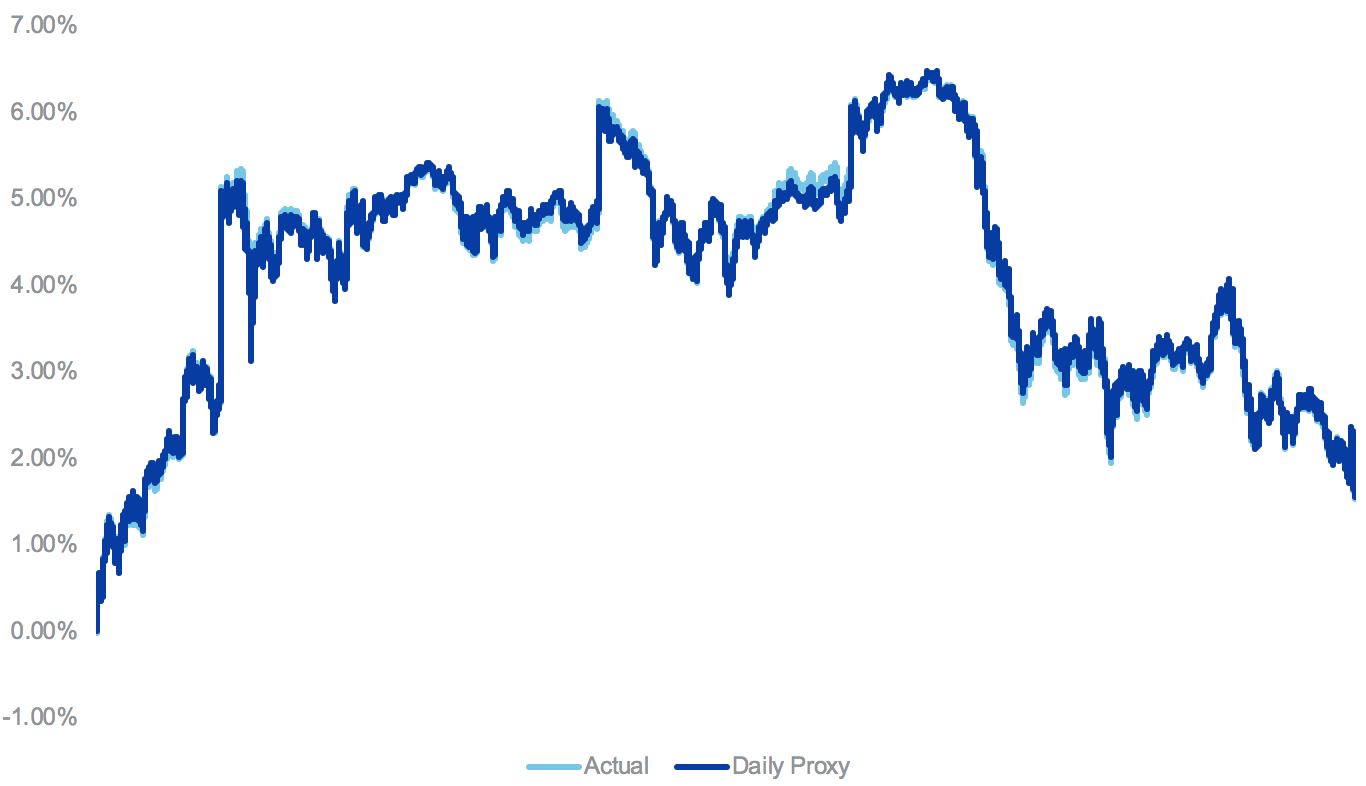
Average Daily Portfolio Overlap*: 66.66%
Average Expected Daily Tracking Error: 0.183%
Average Actual Daily Tracking Error: 0.062%
*Portfolio overlap is the common weight between the actual portfolio (actual holdings not disclosed to public) and proxy portfolio (created daily and disclosed to public as create/redeem basket).
Even with ~25% of the actual portfolio excluded from the daily proxy that would serve as a create/redeem basket, the tick-by-tick absolute average difference was 0.002% and the max difference was 0.681%. This demonstrates the strong intra-day relationship between the created proxy and the non-disclosed actual portfolio.
The Growth of Active ETFs
If you would like additional details/data from this exercise or if you have a portfolio or strategy that you would like to see tested, please contact [email protected].
ETF Stat Pack
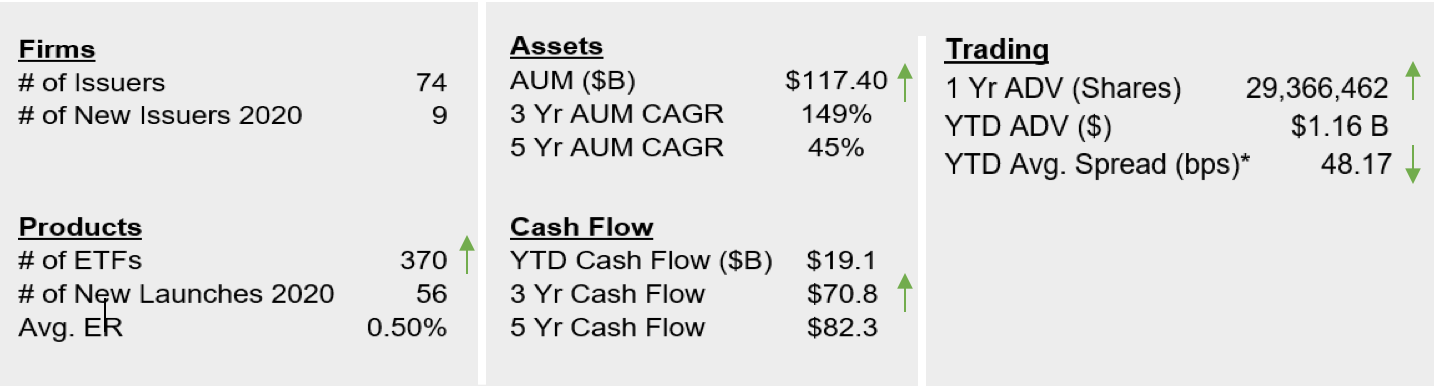
Source: Factset & NYSE Internal Database and Consolidated Tape Statistics as of 6/26/2020
*Simple Average