
October 23, 2020
NYSE recently hosted a Virtual Options Update, which included a review of industry liquidity trends. We highlighted some key themes impacting market volume:
Declining Market Correlations Creating More Varied Risk and Opportunity
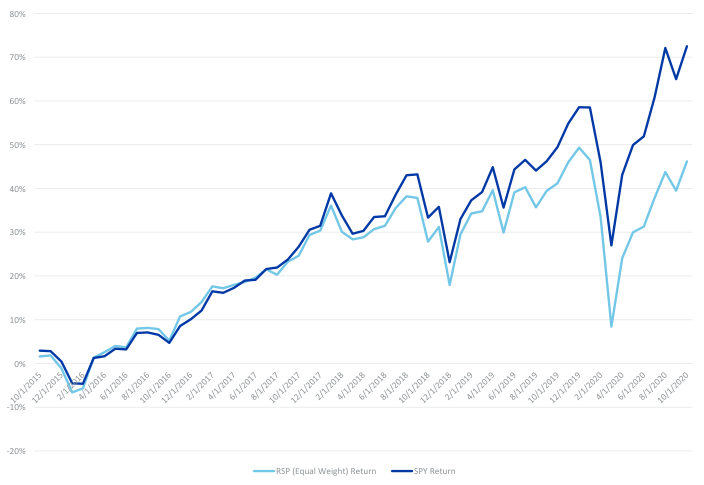
- A large divergence has emerged between the (market-cap weighted) S&P 500 and an equal-weighted version of the index
- This means getting efficient exposure to better performing stocks in an index may be even more critical to maximize returns
5 Year Return: SPY vs. RSP (Equal Weight S&P 500)
Options Can Help Offer Exposure to High-Priced Stocks
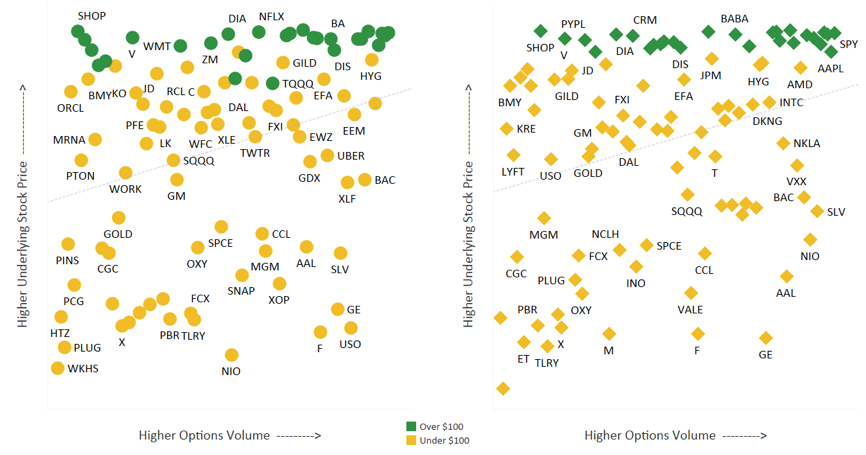
- As market returns have become more varied, efficient exposure to certain stocks has become more impactful to overall portfolio returns
- Options can help address this need and we have seen increasing options popularity for some of the highest-price underlying stocks
March - Options ADV Rank vs. Underlying Price Rank
September - Options ADV Rank vs. Underlying Price Rank
Changes in Market Return Patterns Has Contributed to Less Options Volume Concentration
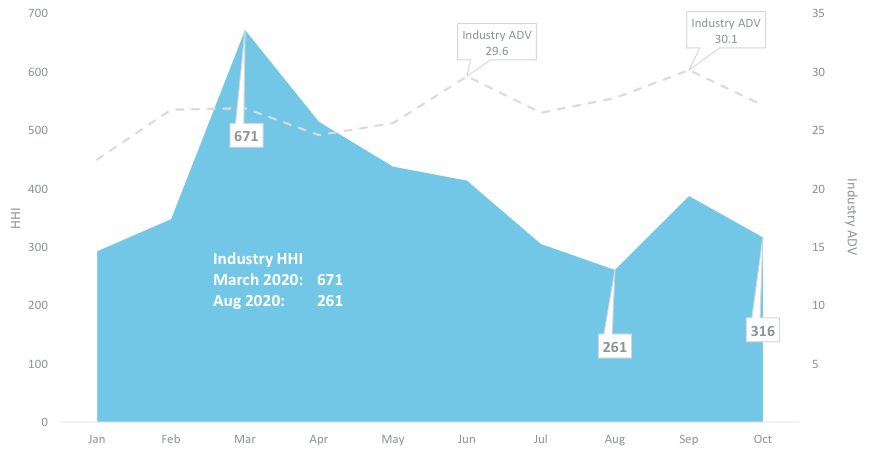
- We applied the Herfindahl-Hirschmann Index (HHI), a measure of market concentration, to the underlying symbols in the options market
- Volatility and macroeconomic uncertainty in March led to increased concentration, particularly in broad-market ETFs, while the recent divergence of returns has reduced concentration
2020 Options Symbol Concentration: Herfindahl-Hirschman Index (HHI)
For further information on these trends, and to discuss how NYSE Options can help navigate this market environment, contact [email protected].
NYSE Research Insights
Find all of NYSE Research's articles on market quality, market structure, auctions, and options.