May 25, 2020
Kevin Tyrell, Head of Strategy and Research, NYSE
Steve Poser, Director, Research, NYSE
After much anticipation, the SEC has proposed a “Transaction Fee Pilot,” which would impose additional price controls on exchange access fees and rebates. As proposed, all equity exchanges (but not alternative trading systems (“ATS”) or other over-the-counter (“OTC”) trading venues) would be required to reduce access fees and/or reduce or eliminate rebates on 3,000 stocks for a period of up to two years. While some commentators equate a lower access fee with a better trade price, we have seen little analysis of the Proposal’s actual cost or benefit to investors. To fill this void, we are presenting two approaches that attempt to roughly quantify the Proposal’s potential impact on investors.
The analysis involves numerous assumptions, and we welcome any and all feedback. First, we assume that a reduction in access fees will result in a reduction in rebates. Second, we assume that with a lower rebate, spreads will widen.
The widening of spreads is generally accepted as a cost to investors because of the related increased transactions costs, particularly for agency liquidity-seeking order flow. Importantly, a wider spread will result in higher trading costs for this type of flow regardless of whether the order trades on an exchange or an off-exchange venue that derives prices from exchanges.
As demonstrated in the chart below, we find that as access fees decline, the cost to investors will increase by at least $1bn, increasing to nearly $4bn should such changes be applied to the entire market. While all investors would absorb the costs of wider spreads, the benefits from the proposed reduction in access fees would accrue primarily to sell-side brokers and proprietary traders
![]()
Top-Down Assessment of Fee Pilot Proposal
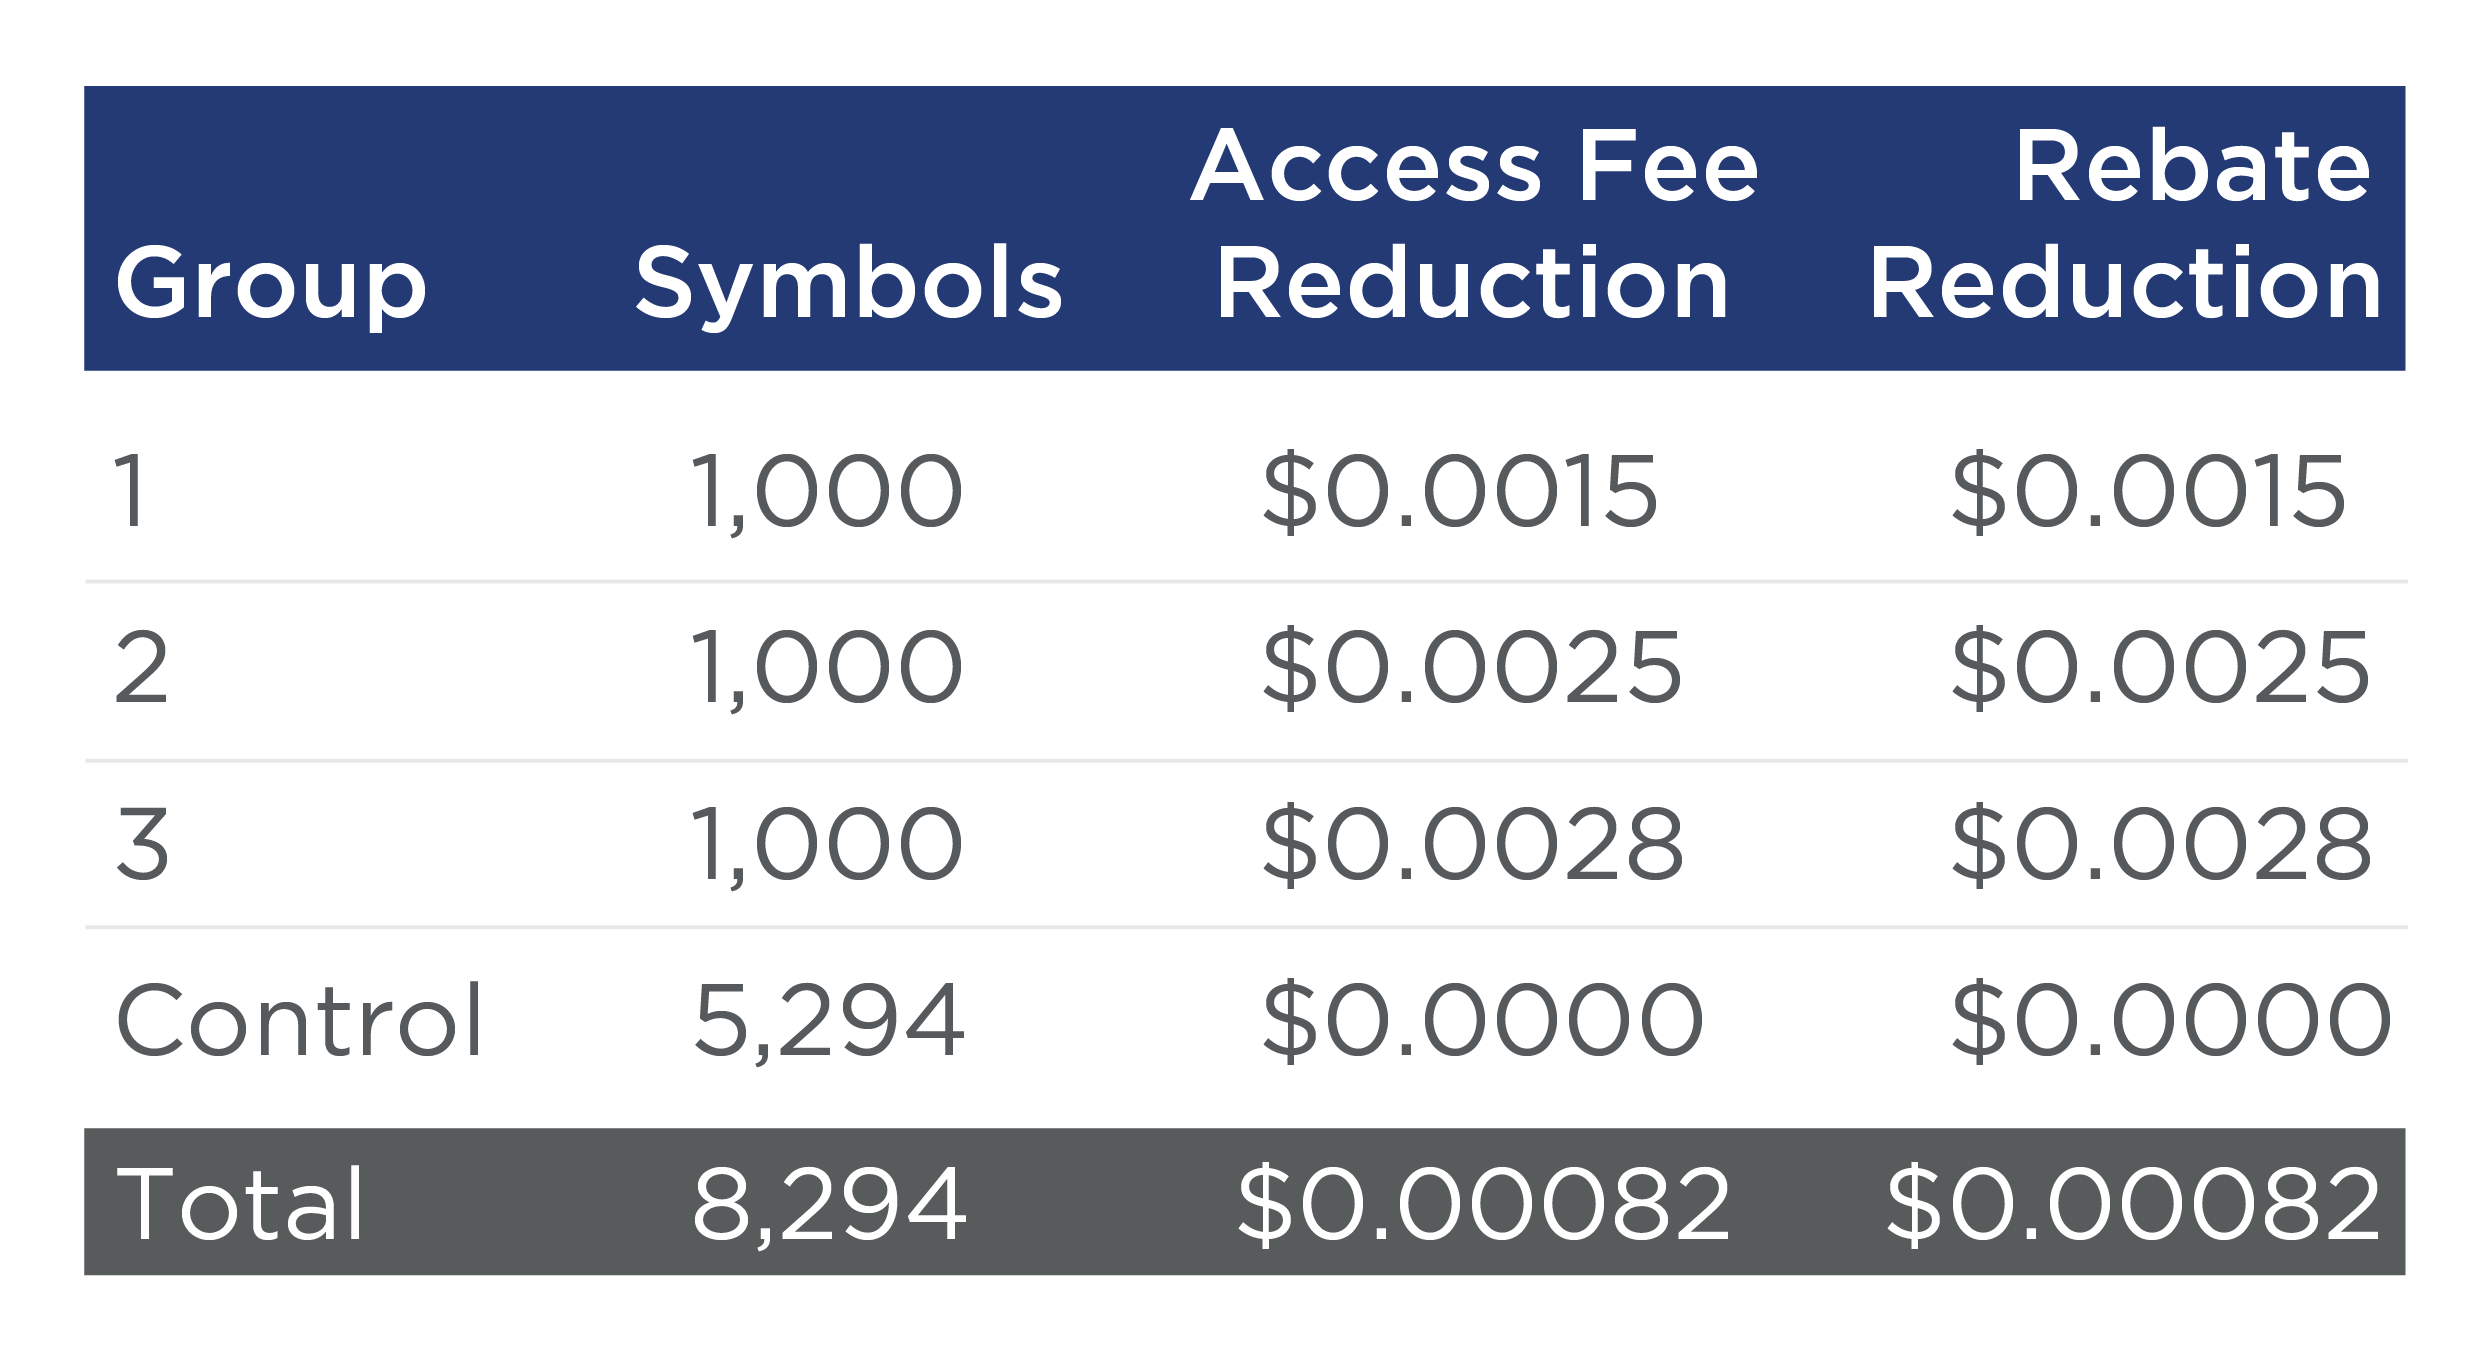
We first estimated costs using a top-down approach, which applies the proposed Fee Pilot changes to current average market-wide statistics. We assumed that rebates on trades in securities in each proposed Trade Groups would fall by the same amount as access fees would fall. For Group 3 (the “no-rebate” group) we assumed that market forces would reduce the access fee to $0.0002. We expect Group 3 to settle at a rate below Group 2’s $0.0005 cap as there is no rebate allowed on the other side of the trade; we also note that flat-fee venues which charge both sides of a trade today are generally priced between $0.0000 and $0.0003. As shown in the following table, this yields a blended access fee reduction of $0.00082 per share.
In order to find the expected new average spread, we identified the following calculation to apply the impact of the rebate reduction to consolidated spreads:
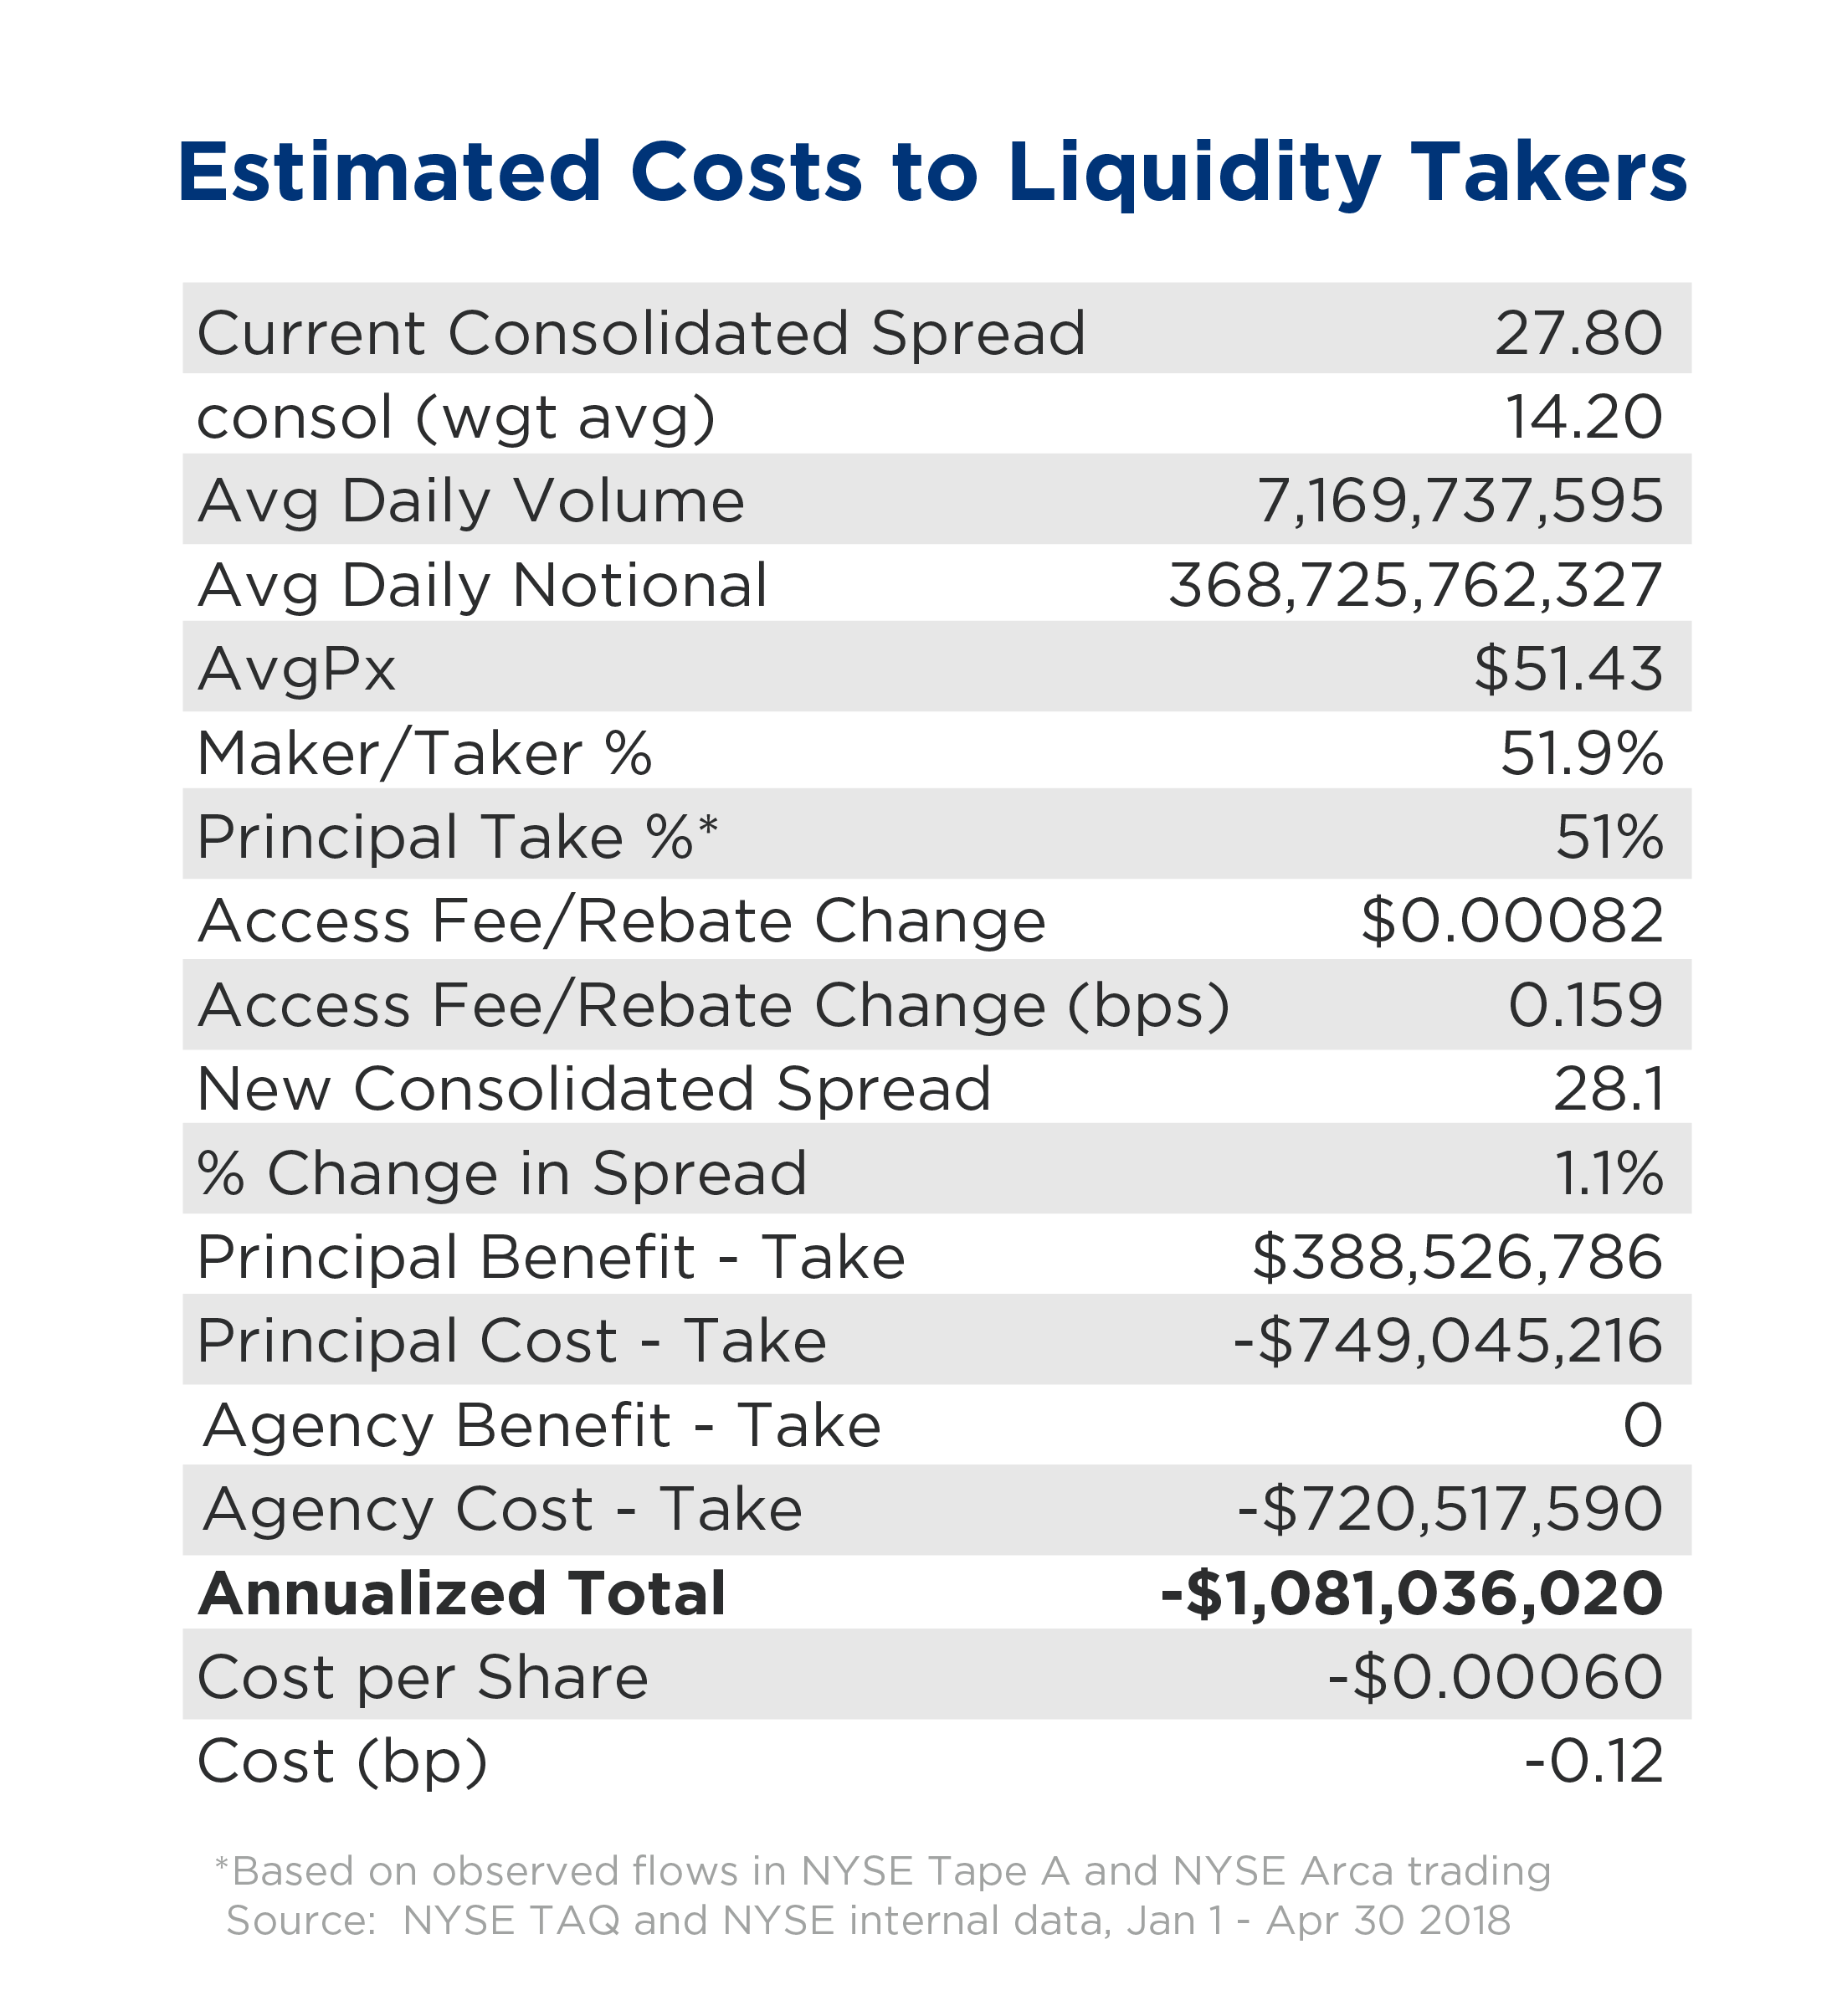
New Consolidated Spread = Current Consolidated Spread + Rebate Reduction * 2
The Current Consolidated Spread is the median market-wide bid-ask spread, and the Rebate Reduction is the $0.00082 blended average fee change. The Rebate Reduction is multiplied by 2 as we anticipate market makers will adjust both their bids and offers to account for the new pricing structure. This calculation results in a 1.1% increase in average spreads, to 28.1 basis points (bps).
As noted by the SEC in its proposal, brokers that are subject to exchange fees and rebates generally do not pass those costs/credits to their customer. We therefore assess principal and agency flow differently as principal flow is impacted by both explicit exchange fees and spread costs, while the ultimate customer behind an agency order incurs spread costs but usually does not pay explicit exchange fees. We also assume that the principal flow benefit from the fee reduction applies to maker/taker activity, but the higher spread cost applies to all principal and agency flow in the market.
Our cost to investors is found by calculating the cost to cross the new, wider spread; our cost to principal traders is found by calculating the cost to cross the new, wider spread netted against the benefit from lower access fees. Spread costs here are considered to be ½ the quoted spread for liquidity-taking flow, per standard transaction cost analysis measurement of performance against arrival price.
Our results show, on net, an estimated cost of $1.08bn to the industry, of which $721MM would be incurred by agency flow.
We believe that this result is somewhat conservative, primarily due to the assumptions of 1) no change in quote size despite the wider spread, 2) no shift in venue market share, and 3) applying the NYSE and NYSE Arca principal/agency ratio despite the fact that the market-wide agency taking share is much higher. This second assumption likely limits our estimated cost substantially, as a quick glance at major retail brokerage firms’ 606 reports indicates that nearly all held market orders are executed OTC. These conservative assumptions are offset by the exclusion of taker/maker (i.e., rebate to take and fee to add) venues’ impact on principal flow, the assumption that all agency flow does not pay explicit exchange fees, and by not assigning any benefit to liquidity-providing agency flow from a wider spread. We also assume a representative amount of volume in each of the pilot groups, which could be incorrect in either direction.
The below chart shows the distribution of the spread cost increase and the access fee decrease for the proposal’s three groups compared to the current market average. This again assumes an even distribution of liquidity characteristics across stocks. The access fee paid by brokers is small relative to spread costs in today’s world, and could fall as much as 93% for Group 3 stocks.
![]()
Bottom-Up Assessment of Rebate Elimination
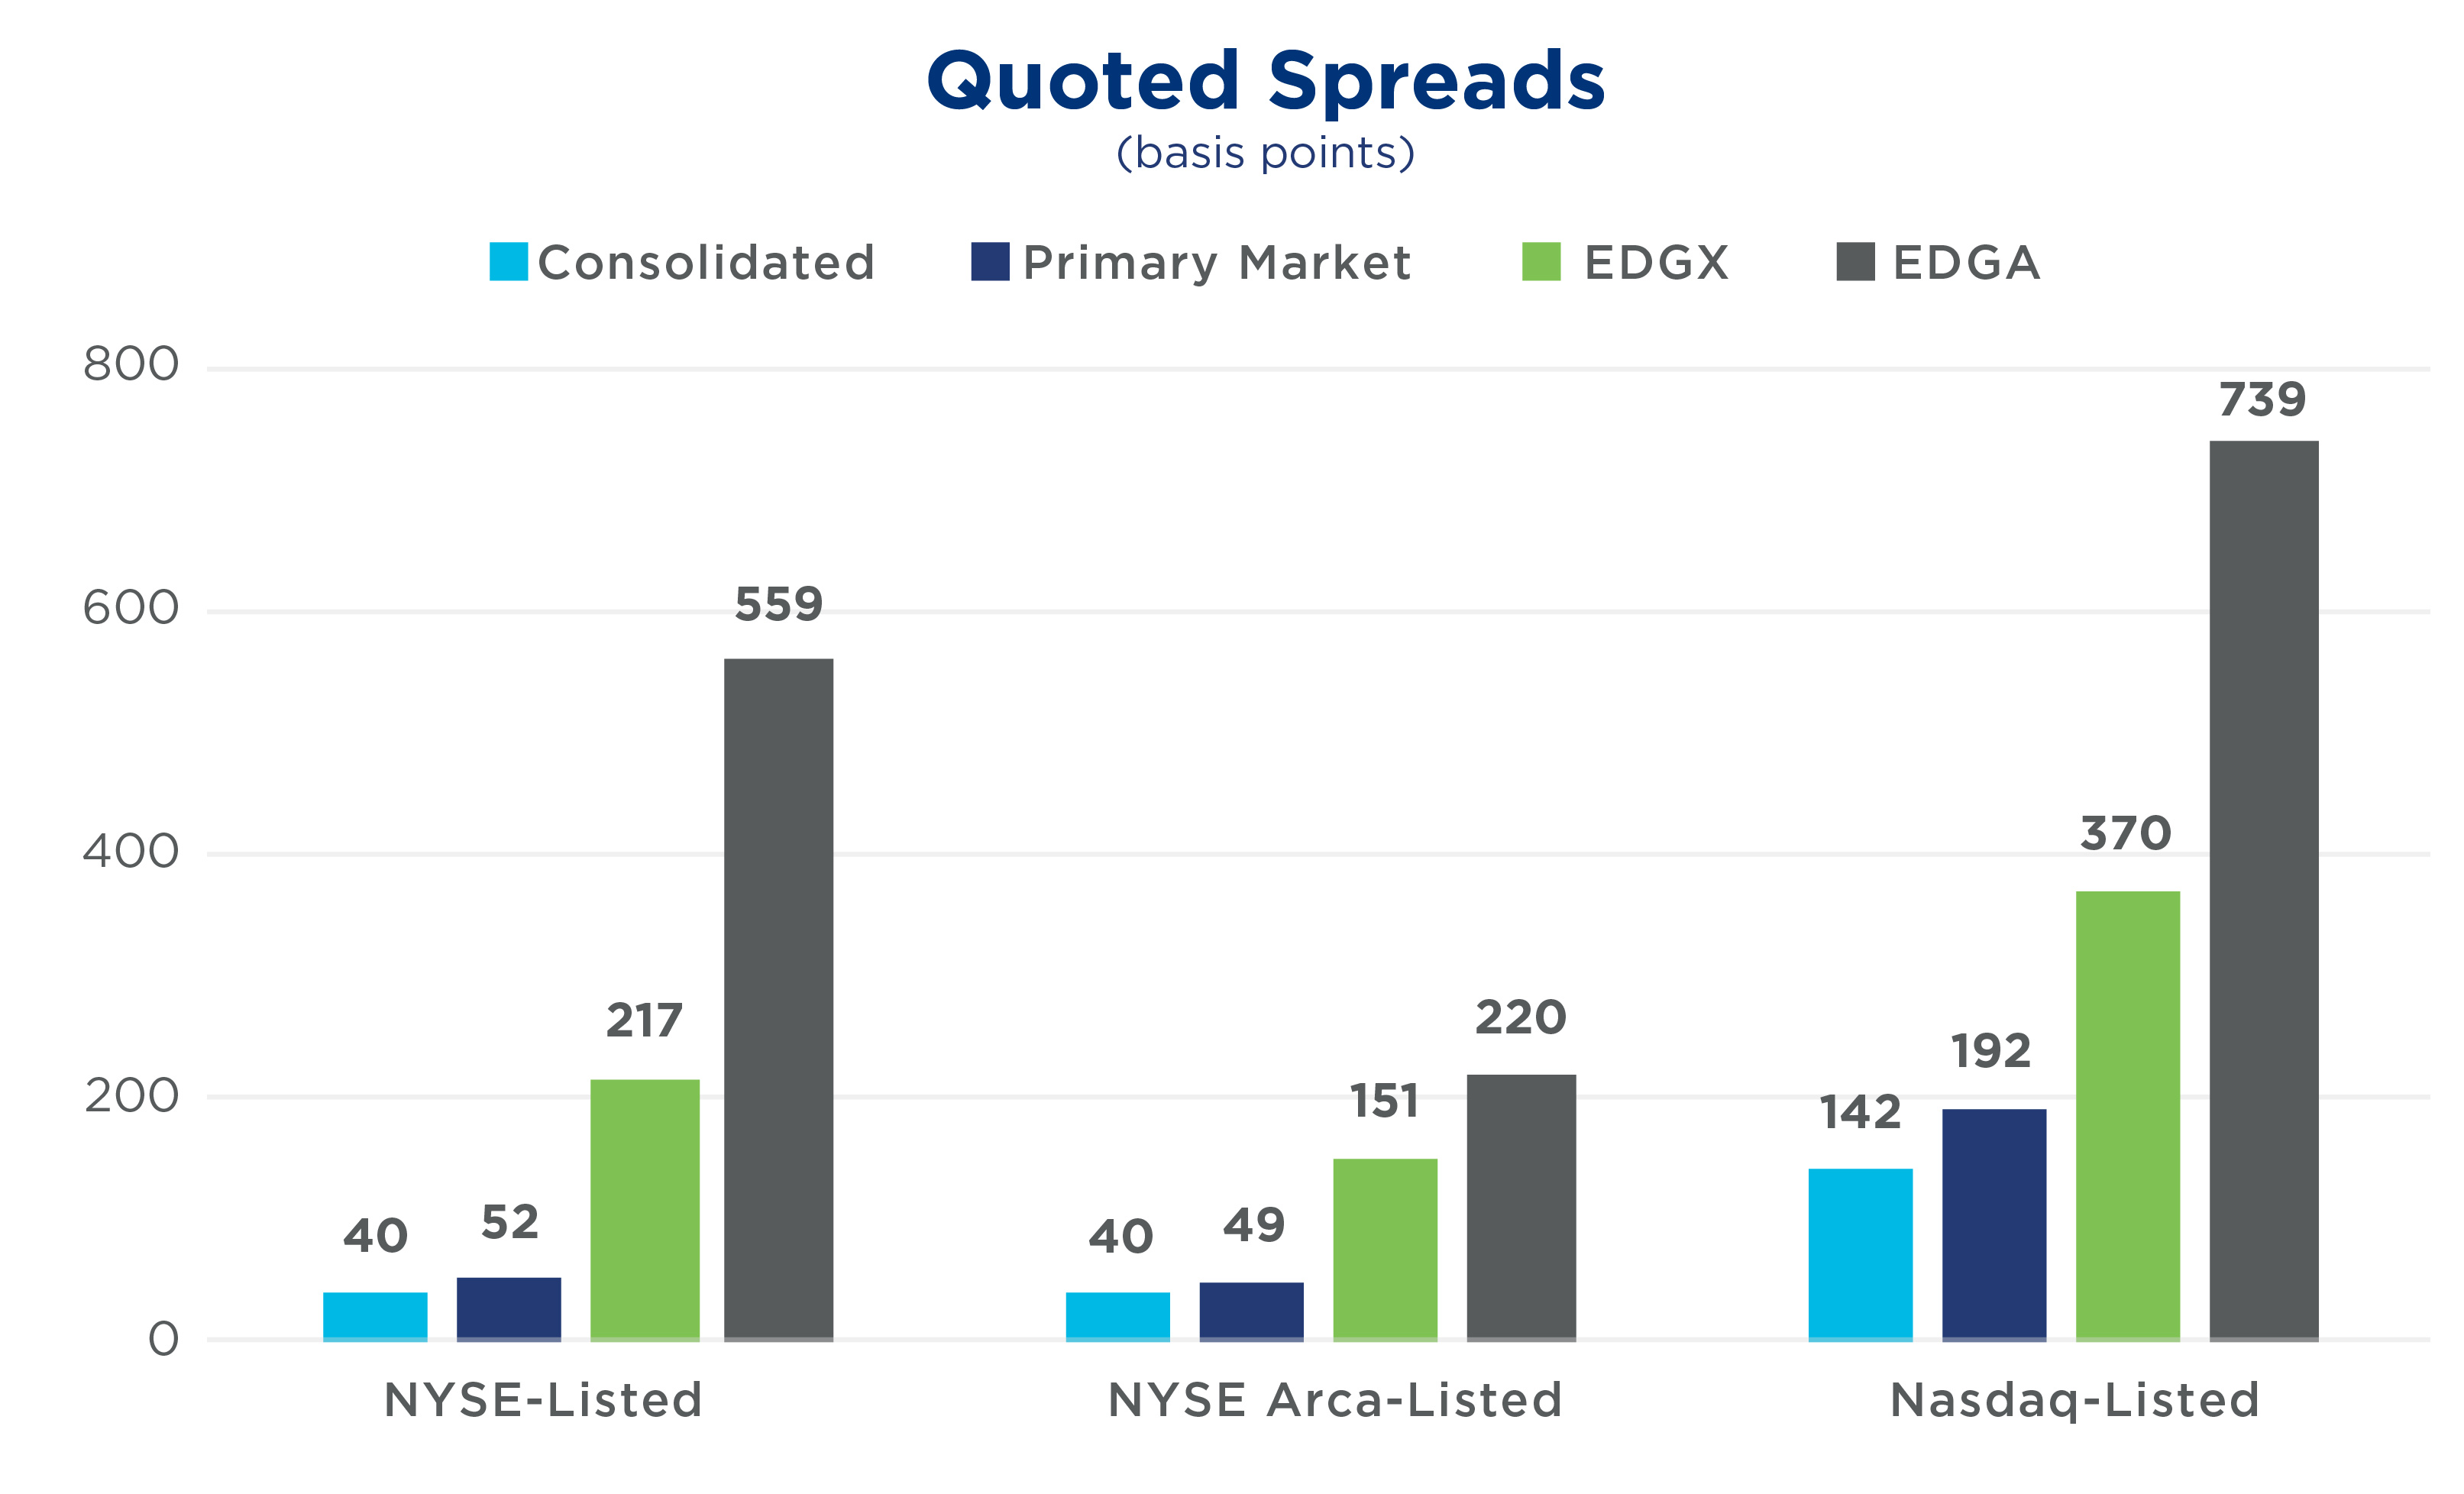
We also estimated changes from eliminating rebates across the market as a whole. We used a “bottom-up” approach that looked at the difference in quoted spreads for each stock trading on Cboe EDGX Exchange, Inc. (“EDGX”, which is a maker-taker venue) and Cboe EDGA Exchange, Inc. (“EDGA,” which is a flat-fee venue). EDGA and EDGX are very similar in that neither is a listing market, and both operate on the same technology in the same location. Accordingly, any differences in spreads between the two markets could be due to the different pricing models available on each exchange.
In aggregate, the EDGA average spread is roughly twice that of EDGX, but there is substantial variation by symbol. To account for this variation, we applied the difference in spread to the current consolidated spread for each symbol, capped that difference to 25%, and then further limited the maximum spread difference to the ratio of the primary exchange spread to the EDGX spread (these limitations were to account for the variance between venues and the fact that we are modeling a world with narrower differences in exchange pricing). The chart below shows the differences in average quoted spread between these two venues, the primary market and the consolidated quote.
We believe that eliminating rebates would widen spreads, as demonstrated by EDGA’s wider spreads relative to EDGX. Accordingly, applying this wider spread to current trading activity of all NMS securities on all equity exchanges would result in an impact of roughly $3.8bn per year, once again born largely by agency liquidity-taking flow. We also checked this result by setting all stocks to group 3 in the first model; our result in that case was a similar $3.7bn impact.
To recap, we have used two different models to assess the impact of reduced fees and rebates on liquidity-seeking flow. We find a $1bn cost from the proposed Transaction Fee Pilot, rising to $3.8bn should such limitations be applied across the market. As stated, any such analysis requires numerous assumptions, and we encourage input from market participants on how we could further refine this assessment of investor cost.
NYSE Research Insights
Find all of NYSE Research's articles on market quality, market structure, auctions, and options.